
Home Sales Surge in July for Kitchener Waterloo and Cambridge
Hope you enjoyed a wonderful long weekend and the beautiful summer weather we have been having.
It was another crazy month for home prices here in Waterloo Region. Competition stays very high for buyers looking to lock down a house in July. With the rules around covid relaxing and more people getting out with Phase 3 opening the demand for homes has increased for sure.
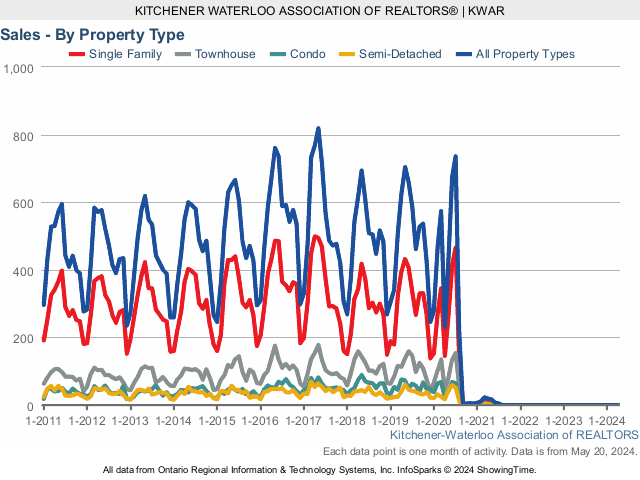
There were 734 residential homes sold in July, an increase of 25.7 per cent compared to the same month last year, and well above the previous ten-year average for July of 531.
Total residential sales in July included 464 detached homes (up 39.3 per cent from July 2019), and 65 condominium apartments (up 3.2 per cent). Sales also included 153 townhouses (up 4.8 per cent) and 52 semi-detached homes (up 23.8 per cent).
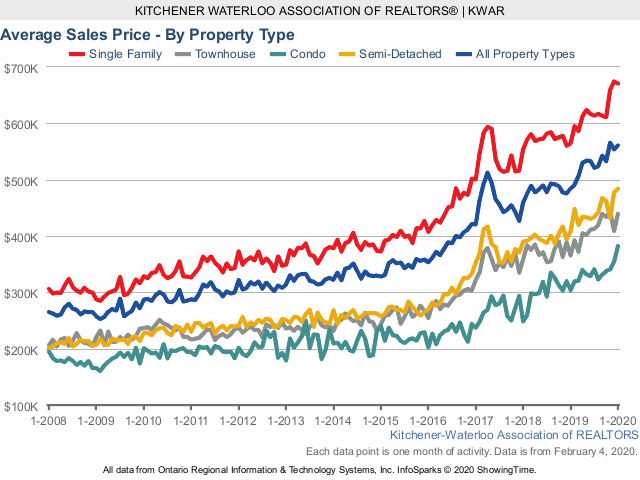
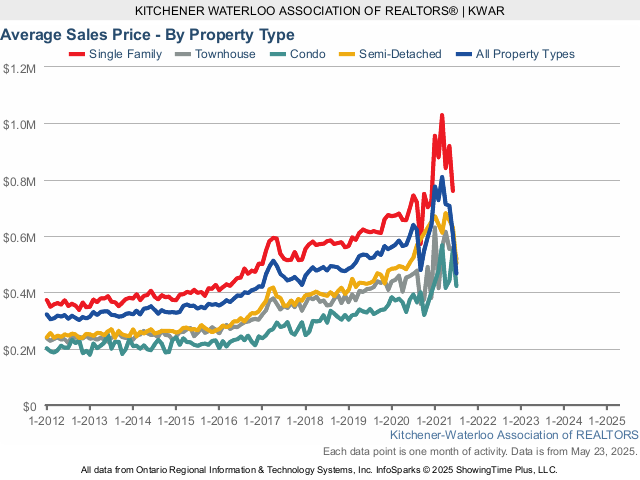
The average sale price of all residential properties sold in July increased 22.8 per cent to $639,814 compared to the same month last year, while detached homes sold for an average price of $745,149 an increase of 21.4 per cent. During this same period, the average sale price for an apartment-style condominium was $392,770 for an increase of 15.2 per cent. Townhomes and semis sold for an average of $465,756 (up 12.8 per cent) and $522,872 (up 20.4 per cent) respectively.
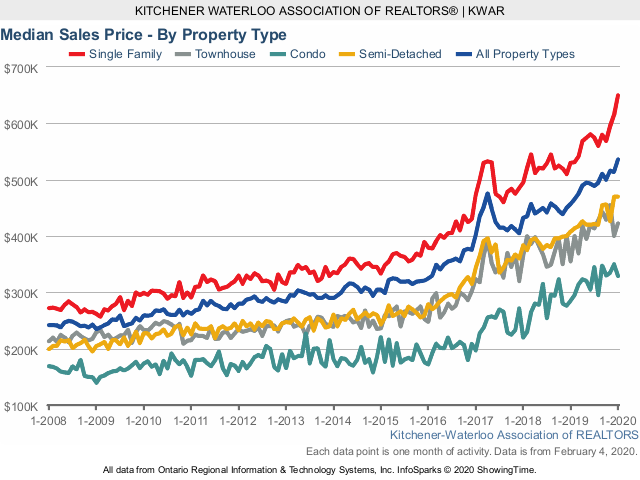
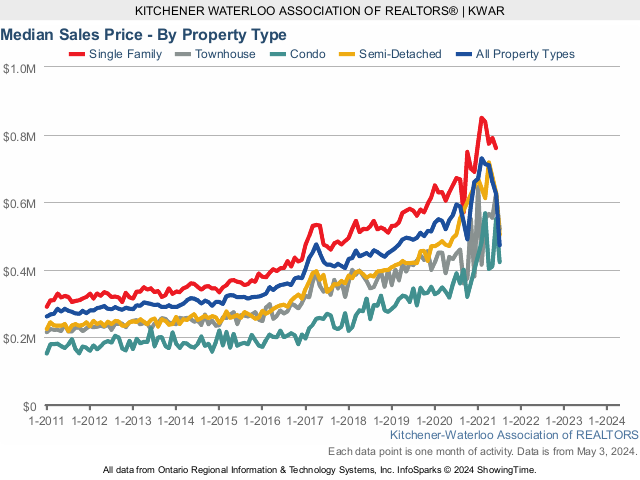
The median price of all residential properties sold in July increased 21.7 per cent to $595,000 and the median price of a detached home during the same period increased 17.4 per cent to $675,000.
With mortgage rates near all time lows homebuyers remain very confident about owning a home in Waterloo Region and I expect this to contunie going into the fall.
There were 888 new listings added, an increase of 4.3 per cent compared to July of last year, and 15.5 per cent more than the previous ten-year average for July.
The total number of homes available for sale in active status at the end of July was 592, a decrease of 32.6 per cent compared to July of last year.
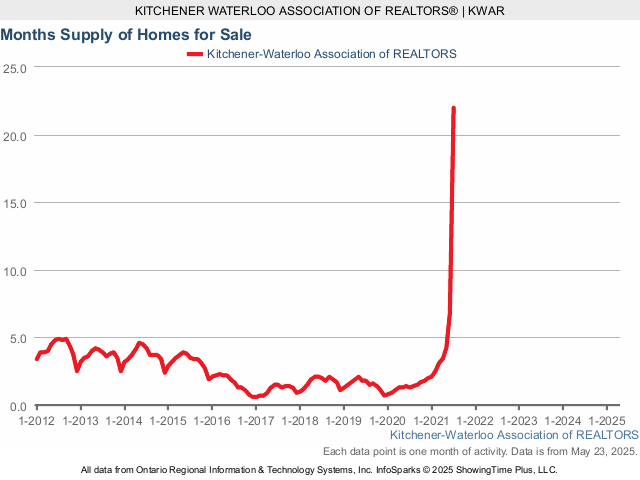
The number of Months Supply (also known as absorption rate) continues to be very low at just 1.3 months for the month of July, 27.8 per cent below the same period last year. The previous ten-year average supply of homes for July was 3.1 months, and in the past 5 years, the average supply for July was 2.1 months.
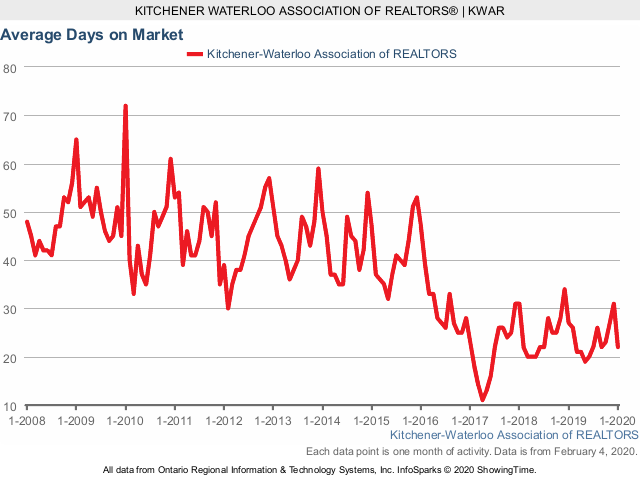
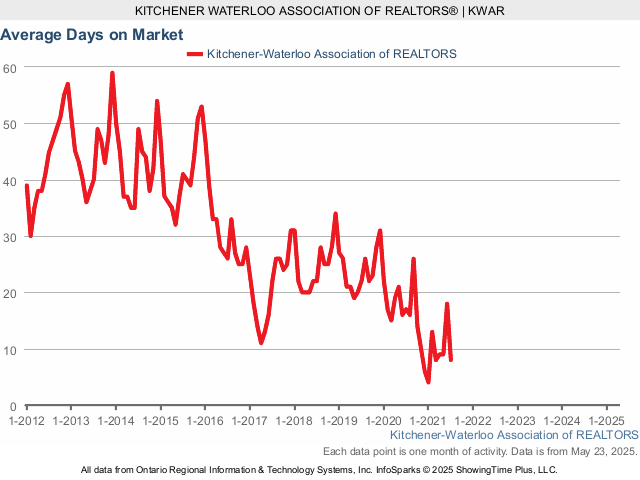
The average days to sell in July was 17 days, compared to 22 days in July 2019.
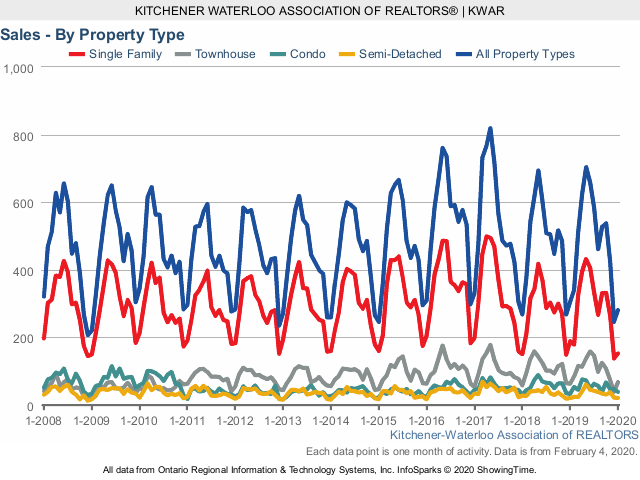
Historical Sales By Property Type

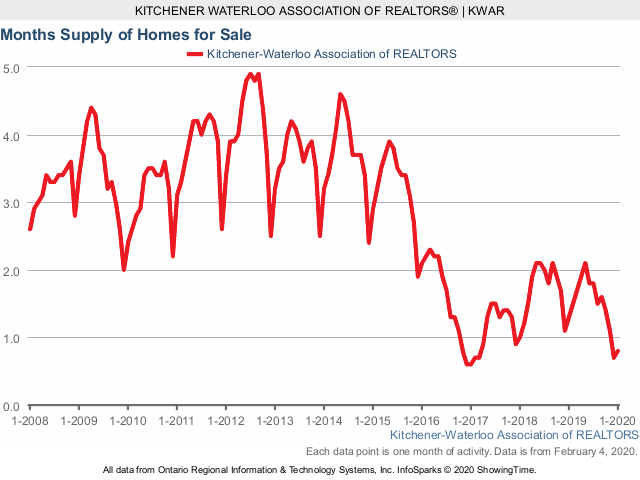
Months Supply of Homes for Sale

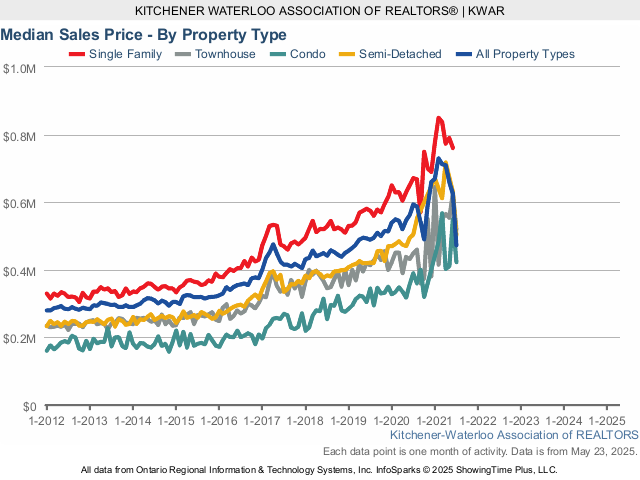
Historical Median Sales Price – By Property Type

Historical Average Sales Price – By Property Type

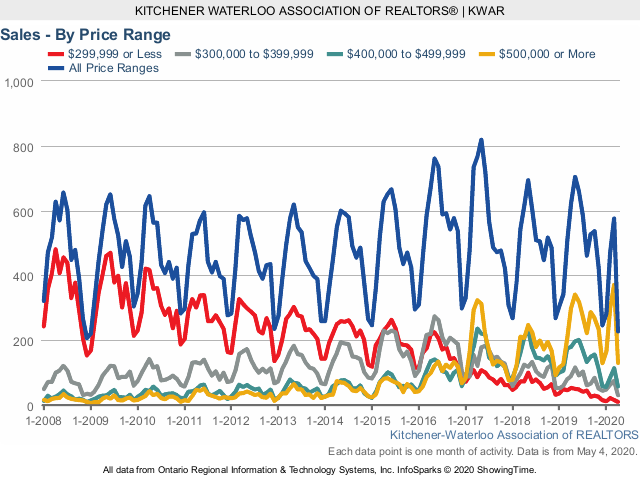
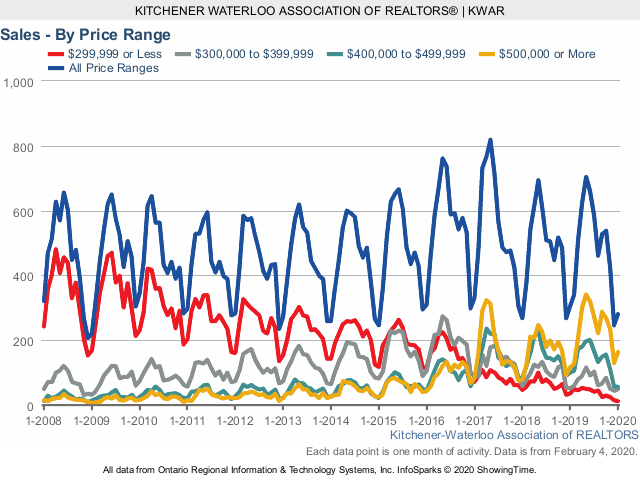
Historical Sales – By Price Range


If you are thinking of buying or selling in the coming months or have any questions at all, give me a call, text at 519-497-4646 or shoot me an email to kevinbaker@kwhometeam.ca Stay healthy and stay safe!
Have a great weekend!
Kevin
June Home Sales Spring Back and Prices Climb in Kitchener Waterloo
Hope you enjoyed a wonderful Canada Day, and are staying cool during our summer heat wave! The spring market may have been delayed due to Covid 19 but it has sprung back in a big way in June.
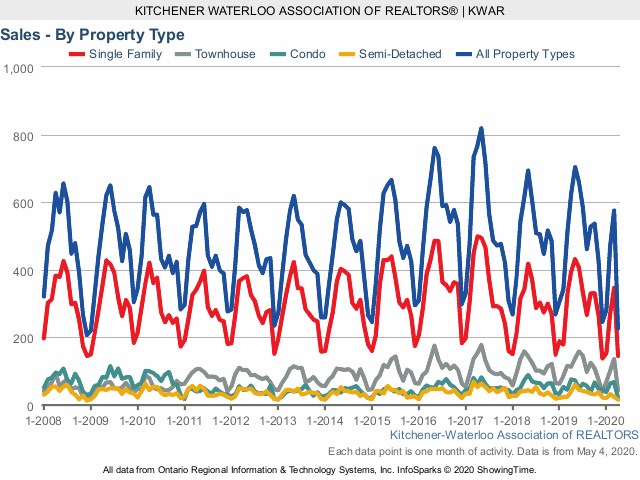
The number of homes sold in June shot up 57.6 per cent compared to May. There were 673 residential homes sold in June 2020, an increase of 2.1 per cent compared to June 2019, and an increase of 8.5 per cent compared to the previous 10-year average for June.
Total residential sales in June included 413 detached homes (up 1.7 per cent from June 2019), and 67 condominium apartments (up 36.7 per cent). Sales also included 134 townhouses (down 15.7 per cent) and 59 semi-detached homes (up 31.1 per cent).
Total residential sales during this second quarter (April, May, June) are down 33 per cent compared to last year. On a year-to-date basis, they are down 15.6 per cent.
I expect for the remainder of 2020 will see the number of home sales returning to near historical levels. There will be some catching up to do in the coming weeks, but I don’t think you will see the market taking the summer off.
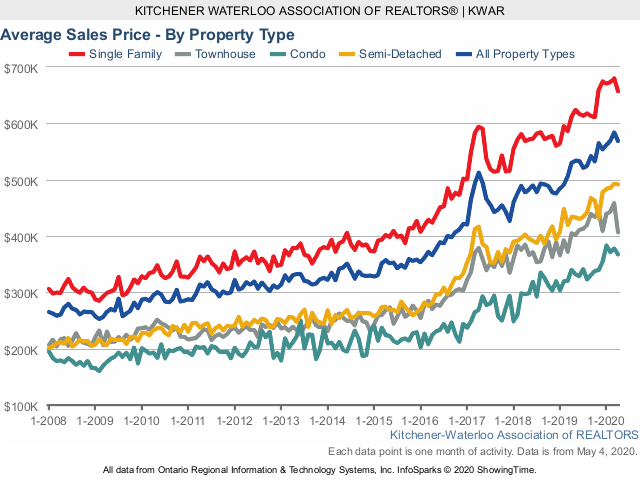
The average sale price of all residential properties sold in June increased 12.8 per cent to $601,285 compared to the same month last year, while detached homes sold for an average price of $698,736 an increase of 13.2 per cent. During this same period, the average sale price for an apartment-style condominium was $372,392 for an increase of 13.2 per cent. Townhomes and semis sold for an average of $457,851 (up 11.4 per cent) and $504,816 (up 17.3 per cent) respectively.
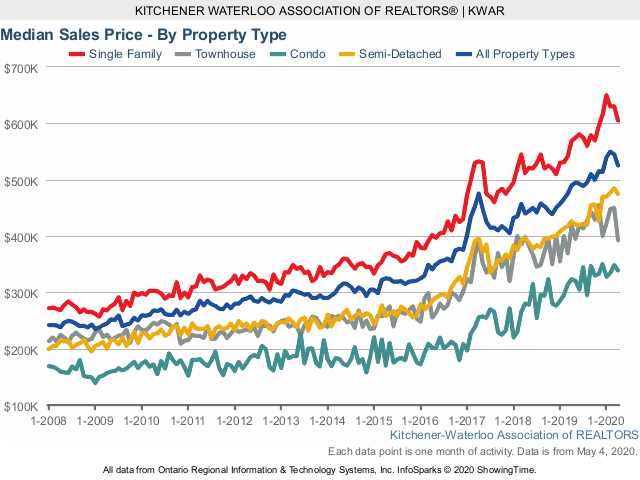
The median price of all residential properties sold in June increased 14.4 per cent to $564,000 and the median price of a detached home during the same period increased 11.9 per cent to $650,000.
There were 920 new listings added in KW and area last month, the most added in a single month since May of last year, and 1.9 per cent more than the previous ten-year average for June.
The total number of homes available for sale in active status at the end of June was 640, a decrease of 28.7 per cent compared to June of last year.
The number of Months Supply (also known as absorption rate) continues to be very low at just 1.4 months for the month of June, 22.2 per cent below the same period last year. The previous ten-year average supply of homes for June was 3.22 months, and in the past 5 years, the average supply for June was 2.22 months.
The average days to sell in June was 16 days, compared to 20 days in June 2019.
Historical Sales By Property Type
Months Supply of Homes for Sale

Historical Median Sales Price – By Property Type

Historical Average Sales Price – By Property Type

Historical Sales – By Price Range


If you are thinking of buying or selling in the coming months or have any questions at all, give me a call, text at 519-497-4646 or shoot me an email to kevinbaker@kwhometeam.ca Stay healthy and stay safe!
Have a great week!
Kevin
April Home Sales Down but Prices Remain Steady in Waterloo Region
Hope you have been staying safe during the past 2 months. It looks like things will start to open back up in stages and at some point things will be hopefully back to normal. Rest assured Yogi and I are here to help if you and your family need to make a move and we have the tools and systems in place for both buyers and sellers for proper marketing of our listings, getting buyers to view the properties, as well as ourselves to keep everyone safe.
I thought you would like an update on what is happening out there in the Waterloo Region Real Estate Market, so here are the stats for April.
There were 227 residential homes sold through the Multiple Listing System in April, a decrease of 63.6 per cent compared to the same month last year, and the lowest number of sales in a single month since December 2008.
I think it goes without saying the current pandemic has had a major impact on the number of sales we would normally see in April, with everyone doing their part to flatten the curve and doing their best to self-isolate, the buying and selling of homes have been greatly reduced.
Total residential sales in April included 145 detached homes (down 63.3 per cent), and 22 condominium apartments (down 71.1 per cent). Sales also included 44 townhouses (down 61.1 per cent) and 16 semi-detached homes (down 60 per cent).
The average sale price of all residential properties sold in April increased 7.3 per cent to $568,738 compared to the same month last year, while detached homes sold for an average price of $657,042 an increase of 7.3 per cent. During this same period, the average sale price for an apartment-style condominium was $367,230 for an increase of 8.1 per cent. Townhomes and semis sold for an average of $406,463 (up 0.4 per cent) and $491,816 (up 13.3 per cent) respectively.
The median price of all residential properties sold in April increased by 7.1 per cent to $525,000 and the median price of a detached home during the same period increased 6.3 per cent to $605,000.
There were 417 new listings added to the MLS® System in KW and area last month, a decrease of 54.8 per cent compared to April of 2019, far fewer than the previous 10-year average of 937 listings in April.
The total number of homes available for sale in active status at the end of April was 571, a decrease of 36.6 per cent compared to April of last year.
The number of Months Supply (also known as absorption rate) continues to be very low at just 1.2 months for the month of April, 36.8 per cent below the same period last year. The previous ten-year average supply of homes for April was 2.95 months, and in the past 5 years, the average supply for April was 2.12 months.
I am confident that despite the current pandemic, the slowdown in housing sales will be temporary. We are still in a strong sellers’ market and with buyers competing for a scare number of listings, now is still a great time to buy. Now for the first time in a long time, April saw some balance with a sales-to-new-listings ratio of 54 percent – well within the balanced threshold. I have talked to some buyers expecting homes to sell at greatly reduced amounts, and frankly, that’s simply not the case. Home values have remained stable which I expect will continue into 2020.
The average days to sell in April was 19 days, compared to 21 days in April 2019.
Historical Sales By Property Type
Months Supply of Homes for Sale

Historical Median Sales Price – By Property Type
Historical Average Sales Price – By Property Type
Historical Sales – By Price Range

If you have any questions or concerns at all, give me a call or text at 519-497-4646 or shoot me an email to kevinbaker@kwhometeam.ca . Stay healty and stay safe!
Have a great week!
Kevin
Home Sales in Kitchener Waterloo come in Like a lion and out like a Lamb in March
Hope you have been staying safe during this unique time in all our lives. Rest assured Yogi and I are doing everthing we can to prevent the spread by staying home as much as posssible and limiting client interactions to phone calls, facetime, zoom meetings, etc. We are both here to help if you and your family need to make a move and we have the tools and systems in place for both buyers and sellers for proper marketing of our listings, getting buyers to view the properties, as well as ourselves to keep everyone safe.
I thought you would like an update on what is happening out there in the Waterloo Region Real Estate Market, so here are the stats for March.
There were 577 residential homes sold in March, an increase of 13.1 per cent compared to the same month last year, and 0.2 per cent below the previous 5-year average.
During the first quarter of 2020, there were 1,327 home sales, 14.6 per cent above last year’s result for the same period and 4 per cent above the previous 5-year average.
Total residential sales in March included 348 detached homes (up 7.1 per cent), and 68 condominium apartments (up 5.1 per cent). Sales also included 136 townhouses (up 17.2 per cent) and 25 semi-detached homes (up 4.2 per cent).
The average sale price of all residential properties sold in March increased 15.3 per cent to $583,752 compared to the same month last year, while detached homes sold for an average price of $679,728 an increase of 15.9 per cent. During this same period, the average sale price for an apartment-style condominium was $378,443 for an increase of 17.9 per cent. Townhomes and semis sold for an average of $457,547 (up 23 per cent) and $492,752 (up 17.4 per cent) respectively.
The median price of all residential properties sold in March increased 14.6 per cent to $544,500 and the median price of a detached home during the same period increased 16.2 per cent to $628,500.
Now of course is this not business as usual for us as Realtors or our clients. As people everywhere follow instructions to only leave their homes for essential reasons, this is impacting the number of showings, and how properties are shown.
There were a higher than average number of homes listed during the Month of March. There were 864 new listings added to the MLS® System in KW and area last month, an increase of 7.6 per cent compared to March of 2019, and the greatest number since 2015. The number of new residential listings was also 3.7 per cent higher than the previous ten-year average for March.
The total number of homes available for sale in active status at the end of March was 535, a decrease of 35.9 per cent compared to March of last year.
Despite the much-needed addition of new inventory coming to the market, the number of Months Supply (also known as absorption rate) continues to be very low at just 1.1 months for the month of March, 35.3 per cent below the same period last year. The previous ten-year average supply of homes for March was 2.73 months, and in the past 5 years, the average supply for March was 1.94 months.
There were also 51 listings last month that were suspended, which means the listing is temporarily “off-market,” and there can be no marketing, showings or offers during this period.
Trying to sell your home while in quarantine, self-isolating or worse yet, while someone in the house is sick, is not going to be in anyone’s best interest. We know many people are postponing their plans to list their home for the time being. As I mentioned earlier, if you find yourself in a situation where you need to buy or sell then rest assured Yogi and I are ready to help and have the tools in place to market, show and sell your home. The number of sales is keeping pace with the new listing inventory so there are still buyers out there looking to buy. We are doing everything we can to keep everyone safe during this time.
Historical Sales By Property Type

Months Supply of Homes for Sale

Historical Median Sales Price – By Property Type

Historical Average Sales Price – By Property Type

Historical Sales – By Price Range


If you have any questions or concerns at all, give me a call or text at 519-497-4646 or shoot me an email to kevinbaker@kwhometeam.ca . Stay healty and stay safe!
Have a great weekend
Kevin
Covid-19 Update for Kitchener Waterloo Real Estate Market March 22-28
I hope you and your family are staying safe and home isolating during these unique and trying times. I am postive that we will come through this stronger and hopefully not take for granted that with friends or dinners out with the family.
I have had several clients and friends reach out to me on what is happening in our current real estate market, so i thought i would put together a couple of brief slides to show you what is currently happening. With everyone being asked to stay home obviously the market has seen slowing of showing activity for homes that are currently on the market. We have also seen a slow down of new listings that have hit the Mls system for Waterloo region.
In the past 10-14 days the showings have dropped off considerably which would be expected given what is happening. Now does that mean that homes are not selling? No, that is not true.. Homes are selling but things are taking a little bit longer than usual and not the “norm” that we have seen over the past 5 years. There are still people that have bought a home prior to this all happening and need to sell their existing home. There are also people that have sold their home and need to buy their next one.
We are still seeing subdued showing activity and have taken strong measures to help both buyers and sellers stay safe when an in person showing is necessary. Buyers are also using current technology such as virtural tours and facetime walk throughts etc. Our first priority is to make sure that our clients and ourselves are staying healthy and safe.
Below is a graph of last weeks activity on our Waterloo Region Real Estate Board.
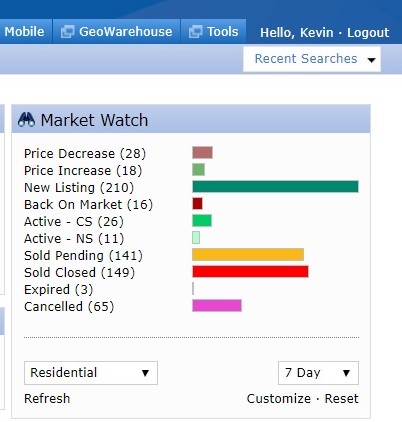
You can see that there were 141 sales last week, which means homes that had offers on them firmed up or had offers come in that had no conditions. There are 37 homes that received offers with conditions that were accepted and 210 new listings hit the market. The closed sales are homes that were sold firm in the past months that closed and the buyers took posession. There were also 65 cancelations which are sellers that may have taken them off the market for now due to lack of activity or Covid 19.
I hope that you find this info helpful to answer any questions or concerns that you are been thinking about during your time at home. As always feel free to reach via text or phone at 519-497-4646, messanger on facebook or we can talk on skype etc. We are not doing an in person meetings during this time and we also utitlze electionic signatures for paperwork that is needed to be completed or for listing a home etc.
It may not be “business as usual” but as an essential service we are open for business. Luckily we can do most of our business from home and online when needed to do so. We are here to help.
Have a great weekend and stay safe.
Kevin
Strong Home Sales in Kitchener Waterloo for February.
Hope you have been enjoying the mild winter we have been having so far even with the latest blast of snow. Spring is right around the corner along with the nice weather and very busy spring market. The stats for february are in it was another strong month of home sales here in Kitchener Waterloo.
There were 467 residential homes sold in February, an increase of 36.5 per cent compared to the same month last year, and 15.3 per cent above the previous 10-year average.
Total residential sales in February included 272 detached homes (up 52 per cent), and 62 condominium units (up 14.8 per cent) which includes any property regardless of style (i.e. semis, townhomes, apartment, detached etc.). Sales also included 32 semi-detached homes (up 33.3 per cent) and 101 freehold townhouses (up 18.8 per cent).
The average sale price of all residential properties sold in February increased 16.3 per cent to $571,023 compared to the same month last year, while detached homes sold for an average price of $673,825 an increase of 13.2 per cent. During this same period, the average sale price for an apartment-style condominium was $371,923 for an increase of 16.4 per cent. Townhomes and semis sold for an average of $443,382 (up 12.9 per cent) and $485,831 (up 8.4 per cent) respectively.
The median price of all residential properties sold in February increased 18.2 per cent to $550,050 and the median price of a detached home during the same period increased 18.6 per cent to $630,000.
Like many other markets across the province, the story of our local housing market continues to be one of supply and demand. Market-wide, the number of homes available for sale is simply not keeping up with the number of people wanting to purchase a home in the Kitchener-Waterloo area.
There were 609 residential properties listed in KW and area last month, an increase of 7.8 per cent compared to February of 2019, and a decrease of 5.9 per cent in comparison to the previous ten-year average for February. The total number of homes available for sale in active status at the end of February was 447, a decrease of 39.4 per cent compared to February of last year, and 62 per cent below the previous ten-year average of 1,179 listings for February. The number of Months Supply (also known as absorption rate) in February was just 0.9 months, 40 per cent below the same period last year. The previous ten-year average supply of homes for February was 2.55 months, and in the past 5 years the average supply for February was 1.76 months.
With a multitude of buyers jumping on a scarcity of properties for sale, many homes are selling for more than the asking price. Using a realtor will ensure you have maximum exposure to these buyers through the MLS® System and will manage the intricate process of any multiple offers professionally.
The average days to sell in February was 17 days, compared to 26 days in February 2019.
Historical Sales By Property Type

Months Supply of Homes for Sale

Historical Median Sales Price – By Property Type

Historical Average Sales Price – By Property Type

Historical Sales – By Price Range


If you have any questions or have been thinking of making a move this spring, give me a call or text at 519-497-4646 or shoot me an email to kevinbaker@kwhometeam.ca . Now is a fantastic time to get top dollar for your home so lets sit down, grab a coffee and plan out a strategy that is best suited for your families needs.
Have a great weekend
Kevin
Homes for sale continue to elude buyers here in Waterloo Region
Hope you have been enjoying the mild winter we have been having so far and Valentines day is just around the corner. The January market stats are out and it seems like the trend we have been seeing in the market is continuing once again.
There were 281 residential homes sold in January, a decrease of 8.2 per cent compared to the previous month. Contrasted to previous Januarys however, home sales last month were only 3.6 per cent below the previous 10-year average, and 3.8 per cent below the previous 5-year average.
For the third consecutive month sales were down in January, which is a direct result of fewer homes being put up for sale. This is causing further price acceleration as we have enough willing and able home buyers contending for those few homes that are available.
Total residential sales in January included 153 detached homes (down 19 per cent), and 39 condominium units (up 18.2 per cent) which includes any property regardless of style (i.e. semis, townhomes, apartment, detached etc.). Sales also included 21 semi-detached homes (on par) and 68 freehold townhouses (up 7.9 per cent).
The average sale price of all residential properties sold in January increased 15.7 per cent to $561,029 compared to the same month last year, while detached homes sold for an average price of $670,944 an increase of 18.8 per cent. During this same period, the average sale price for an apartment-style condominium was 382,636 for an increase of 26.1 per cent. Townhomes and semis sold for an average of $439,765 (up 20.3 per cent) and $484,190 (up 18.7 per cent) respectively.
The median price of all residential properties sold in January increased 17.3 per cent to $536,000 and the median price of a detached home during the same period increased 22.6 per cent to $650,000.
Buyer’s can’t buy what’s not there. The available number of homes for sale, or lack thereof, continued to evade home buyers in January. There is no doubt we would be reporting more sales if we had the inventory to match the demand.
There were 464 residential properties listed in KW and area last month, a drop of 21.1 per cent compared to January of 2019, and a decrease of 35.4 per cent in comparison to the previous ten-year average for January. The total number of homes available for sale in active status at the end of January was 392, a decrease of 38.7 per cent compared to January of last year, and 63.7 per cent below the previous ten-year average of 1,080 listings for January. The number of Months Supply (also known as absorption rate) in January was just 0.8 months, 38.5 per cent below the same period last year. The previous ten-year average supply of homes for January was 2.32 months, however, in the past 5 years the average supply for January was 1.96 months.
The average days to sell in January was 22 days, compared to 27 days in January 2019.
Historical Sales By Property Type
Months Supply of Homes for Sale
Historical Median Sales Price – By Property Type
Historical Average Sales Price – By Property Type
Historical Sales – By Price Range
If you have any questions or have been thinking of making a move this spring, give me a call or text at 519-497-4646 or shoot me an email to kevinbaker@kwhometeam.ca . Now is a fantastic time to get top dollar for your home so lets sit down, grab a coffee and plan out a strategy that is best suited for your families needs.
Have a great Valentines Day!
Kevin
Strong Home Sales Continue here in Kitchener, Waterloo and Cambridge
Hope you had a wonderful Halloween and here is hoping the snow stays away for a little while longer. I wanted to shoot you a quick update on how the real estate market did in November here in Waterloo Region.
There were 538 residential properties sold here in Kitchener-Waterloo in October, an increase of 4.1 per cent compared to the same month last year.
Home sales in October included 334 detached (up 11.3 per cent), and 65 condominium apartments (up 1.6 per cent). Sales also included 108 townhouses (down 6.1 per cent) and 31 semi-detached homes (down 18.4 per cent).
The average sale price of all residential properties sold in October increased by 9.1 per cent to $533,288 compared to October 2018. Detached homes sold for an average price of $610,840 (an increase of 6.2 per cent compared to October of last year. During this same period, the average sale price for an apartment-style condominium was $333,895 for an increase of 6.7 per cent. Townhomes and semis sold for an average of $434,035 (up 11.2 per cent) and $461,590 (up 14.3 per cent) respectively.
The median price of all residential properties sold last month increased 12.4 per cent to $500,000 and the median price of a detached home during the same period increased by 8.3 per cent to $568,950.
The average days it took to sell a home in October was 22 days, which is three days fewer than it took in October 2018.
There were 670 residential properties listed in K-W and area last month, a decrease of 12.4 per cent compared to October of 2018, and a decrease of 3.3 per cent in comparison to the previous ten-year average for the month of October. The total number of homes available for sale in active status at the end of October totalled 691, a decrease of 26.5 per cent compared to October of last year, and well below the previous ten-year average of 1,412 listings for October. Months Supply of Homes for sale stood at 1.4 months in October, which is 26.3 percent lower than the same period last year. The previous ten-year average months supply of homes for October was 3.03.
Seasonal strength in October is common as people to look to make moves before Winter. With a scarcity of listings, buyers continue to snap up properties in the Kitchener-Waterloo area at a fast pace.
Here are some charts….
Historical Sales by Property Type

Months Supply of Homes for Sale

Historical Median Sales Price – By Property Type

Average Sales Price – By Property Type
Historical Sales – By Price Range

If you have any questions or have been thinking of making a move this fall, give me a call or text at 519-497-4646 or shoot me an email to kevinbaker@kwhometeam.ca and lets sit down, grab a coffee and plan out a strategy that is best suited for your families needs.
Have a great November!
Kevin
August Home Sales Ease as Prices Continue to Rise in Kitchener Waterloo.
Hope you had a wonderful weekend. Back to school is here and I am sure all the kids have settled in and got the new school year underway. August was another great month for Waterloo region real estate and here are the stats to keep you right up to date.
There were 459 residential properties sold through the MLS® in August, a decrease of 9.1 per cent compared to the same month last year.
Home sales in August included 267 detached (down 11.9 per cent), and 56 condominium apartments (down 13.8 per cent). Sales also included 97 townhouses (down 4.9 per cent) and 39 semi-detached homes (up 11.4 per cent).
The number of homes sold last month was below the average for August; however, we continue to see strong price gains across all property types.
The average sale price of all residential properties sold in August increased by 6.4 per cent to $524,482 compared to August 2018. Detached homes sold for an average price of $615,568 (an increase of 5.4 per cent compared to August of last year. During this same period, the average sale price for an apartment-style condominium was $324,778 for a decrease of 3.1 per cent. Townhomes and semis sold for an average of $420,239 (up 18.3 per cent) and $441,802 (up 10.2 per cent) respectively.
The median price of all residential properties sold last month increased 8.1 per cent to $495,000 and the median price of a detached home during the same period increased by 2.8 per cent to $560,000.
There were 574 residential properties in K-W and area last month, a decrease of 14.5 per cent compared to August of 2018, and a decrease of 13 per cent in comparison to the previous ten-year average for the month of August. The total number of homes available for sale in active status at the end of August totalled 734, a decrease of 17.3 per cent compared to August of last year, and well below the previous ten-year average of 1,426 listings for August. Months Supply of Homes for sale stood at 1.5 months in August, which is 16.7 percent lower than the same period last year.
The average days it took to sell a home in August was 26 days, which is two days fewer than it took in August 2018.
We’re noting differences in market balance depending on the price range, for homes priced under $600 thousand, it is still a strong seller’s market, whereas above $600 thousand, it is a more balanced situation.
One this to look at is the month’s supply of homes, also known as the absorption rate. For homes priced at more than $600,000, the months of supply stood at 3.4 in August, compared to 0.9 months for homes prices under that amount. Months supply is the inventory of homes for sale at the end of a given month, divided by the average monthly closed sales from the last 12 months. The previous ten-year average months supply across all price ranges has been just over 3 months.
It all comes down to what the buyers can find in their price range, homes in Kitchener-Waterloo are definitely in high demand, and there is strong competition among buyers trying to find one that will suit them.
Historical Sales by Property Type

Months Supply of Homes for Sale

Historical Median Sales Price – By Property Type
Historical Average Sales Price – By Property Type

Historical Sales – By Price Range


If you have any questions or have been thinking of making a move this summer or into the fall, give me a call or text at 519-497-4646 or shoot me an email to kevinbaker@kwhometeam.ca and lets sit down, grab a coffee and plan out a strategy that is best suited for your families needs.
Have a great September!
Kevin
Strong Home Sales for June here in Waterloo Region
Hope you had a wonderful long Canada Day weekend. The weather was absolutely perfect and looks like its going to be a hot one for July.
Here are the stats from the July and the market here in Waterloo Region continues to stay strong. There were 658 residential properties sold through the Multiple Listing System (MLS® System) in June, representing an increase of 8.8 per cent compared to the same month last year.
Home sales in June included 404 detached (up 8.9 per cent), and 50 condominium apartments (down 28.6 per cent). Sales also included 159 townhouses (up 27.2 per cent) and 45 semi-detached homes (up 15.4 per cent).
A total of 3,154 homes have sold in Kitchener-Waterloo and area during the first half of this year, an increase of 1.4 per cent compared to 2018.
The average sale price of all residential properties sold in June increased by 8.9 per cent to $533,619 compared to June 2018. Detached homes sold for an average price of $618,186 an increase of 7.9 per cent compared to June of last year. During this same period, the average sale price for an apartment style condominium was $332,716 for an increase of 4.4 per cent. Town homes and semis sold for an average of $411,126 (up 10.7 per cent) and $430,427 (up 9.9 per cent) respectively.
The median price of all residential properties sold last month increased 9.9 per cent to $494,500, and the median price of a detached home during the same period increased by 11.7 per cent to $581,500
There were 888 residential properties listed in K-W and area last month, an increase of 4.3 per cent compared to June of 2018, and a slight increase of 0.5 per cent in comparison to the previous ten-year average for the month of June. The total number of homes available for sale in active status at the end of June totaled 890, a decrease of 10.8 per cent compared to June of last year, and well below the previous ten-year average of 1,581 listings for June. Months Supply of Homes for sale stood at 1.8 months in June, which is 14.3 percent lower than the same period last year.
We’re still in a solid seller’s market situation heading into the summer months, while more new listings are coming onto the market, strong buying demand is keeping supply tight.
The average days it took to sell a home in June was 20 days, compared to 22 days in June 2018.
Here are some charts to compare different parts of the market over the last 10 years.
Historical Sales By Property Type

Months Supply of Homes for Sale
Historical Median Sales Price – By Property Type
Historical Average Sales Price – By Property Type

Historical Sales – By Price Range

Historical Average Days on Market

If you have any questions or have been thinking of making a move this summer or in the fall, give me a call or text at 519-497-4646 or shoot me an email to kevinbaker@kwhometeam.ca and lets sit down, grab a coffee and plan out a strategy that is best suited for your families needs.
Have a great July!
Kevin
April Home Sales Up in Kitchener Waterloo. Average price hits all time highs!!
Hope you had a chance to enjoy the great weather we had on the weekend. It seemed like a very long winter but summer is just around the corner.
Home sales were up in April and we hit an all time high for the Kitchener Waterloo Real Estate Market average home prices which is very big news!!!
There were 623 residential sales in April, an increase of 1.1 per cent versus the same month last year, and up 2.2 per cent compared to the previous ten-year average for April.
Total residential sales in April included 394 detached (up 15.2 per cent), and 75 condominium apartments (up 1.4 per cent). Sales also included 113 townhouses (down 28.9 per cent) and 41 semi-detached homes (no change).
While sales of detached homes did jump a fair bit compared to the same month last year, they were actually on par with the previous 10-year average for April, which means we are getting back to some better market conditions for both buyers and sellers.
The average sale price of all residential properties sold in April increased by 10.9 per cent to $529,800 compared to April 2018. Detached homes sold for an average price of $611,803 an increase of 7.6 per cent compared to April of last year. During this same period, the average sale price for an apartment style condominium was $339,426 for an increase of 14.3 per cent. Townhomes and semis sold for an average of $405,013 (up 5.3 per cent) and $433,949 (up 7.7 per cent) respectively.
Average sale prices hit an all-time high in April. These are the highest sale prices we’ve ever posted in a single month. It’s only the third time the overall residential sale price has exceeded half a million, and for the first time, the average price of a detached home climbed over the 600-thousand-dollar mark.
Likewise, median prices reached an all-time high in April. The median price of all residential properties sold last month increased 11.4 per cent to $490,000, and the median price of a detached home during the same period increased by 11.1 per cent to $568,500
There were 913 residential properties listed in K-W and area last month, a decrease of 6.9 per cent compared to April of 2018, and a decrease of 1.6% in comparison to the previous ten-year average for the month of April. The total number of homes available for sale in active status at the end of April totaled 884, a decrease of 6.1 per cent compared to April of last year, but still well below the previous ten-year average of 1,485 listings for April. Months Supply of Homes for sale stood at 1.8 month in April a decrease of 5.3 per cent compared to last year.
It’s still very much a seller’s market for anyone who is looking for a home under six hundred thousand. In these challenging market conditions, i believe consumers should always seek the expert advice of a local REALTOR®.
If you have any questions or have been thinking of making a move this spring, give me a call or text at 519-497-4646 or shoot me an email to kevinbaker@kwhometeam.ca and lets sit down, grab a coffee and plan out a strategy that is best suited for your families needs.
Have a wonderful Mothers Day to all the mom’s out there.
Kevin
Frigid February Home Sales Blanket Kitchener Waterloo Home Sales
Hope you have been enjoying the frigid weather that we have had in the past month and trying to stay warm. I just wish it could be over already and can’t wait for spring to be honest. So the stats are out for the past month here in Kitchener Waterloo real estate and the home sales were frigid as well.
There were 343 residential sales in February, a decrease of 8.3 percent compared to February 2018. The series of winter storms in February not only kept buyers indoors and off the roads, but also away from open houses and viewings i am sure. This was the lowest amount of sales we’ve seen in February in a very long time.
Total residential sales in February included 178 detached (down 14.8 percent), and 105 condominium units (down 11 per cent). Sales also included 23 semi-detached homes (down 8 percent), 36 free hold townhouses (down 112 percent).
The average sale price of all residential properties sold in February increased 3 percent to $490,668 compared to February 2018 . Detached homes sold for an average price of $597,965 an increase of 3.9 percent compared to February of last year. During this same period, the average sale price for an apartment style condo was $319,536 for an increase of 20.5 percent. Townhomes and semis sold for an average of $395,331 (up 2.6 percent) and $448,123(up 14.4 percent) respectively.
The median price of all residential properties sold last month increased 6.9 percent to $465,000 and the median price of a detached home during the same period increased 2 per cent to $533,500. Despite the chill in the number of sales last month, the price gains reflect that demand continues to outpace supply which is great for sellers but still makes things difficult for many buyers.
There were 562 residential properties listed in K‐W and area last month, a small increase of 1.1 percent compared to February of 2018. The number of active residential listings on the MLS System to the end of February totaled 785, which is 9 percent more than February of last year, but still well below the previous ten year average of 1,296 listing for February.
The average days it took to sell a home in February was 25 days, which is 4 days longer than the amount of time it took in February 2018.
The market remains very much as it has been for the past several months, but the delayed winter weather finally caught up with it. While the market is coming in like a lamb in March we are expecting it to go out like a lion.
If you have any questions or have been thinking of making a move this spring, give me a call or text at 519-497-4646 or shoot me an email to kevinbaker@kwhometeam.ca and lets sit down, grab a coffee and plan out a strategy that is best suited for your families needs.
Stay warm and enjoy your weekend!
January Home Sales Up in Kitchener Waterloo
I hope you are staying warm during this very unpredictable winter weather. I am sure the kids are loving all the snow days they have had in the past weeks. The stats are out from January and the Kitchener Waterloo Real Estate market enjoyed a great month of home sales.
January was surprisingly busy with an above average number of home sales. There were 307 residential sales in January, an increase of 14.6 percent compared to January 2018 as well as the number of units sold last month were up nearly fifteen percent compared to the previous ten-year average for January.
Total residential sales in January included 189 detached (up 26 percent), and 80 condominium units (up 19.4 percent) which includes any property regardless of style (i.e. semis, townhomes, apartment, detached etc.). Sales also included 20 semi-detached homes (down 28.6 percent) and 17 freehold townhouses (down 19 percent).
The average sale price of all residential properties sold in January increased 5.3 percent to $484,076 compared to January 2018. Detached homes sold for an average price of $564,718 an increase of 1.9 percent compared to January of last year. During this same period, the average sale price for an apartment style condominium was $303,379 for an increase of 22.1 percent. Townhomes and semis sold for an average of $368,227 (up 0.7 percent) and $407,852 (up 4.6 percent) respectively. The median price of all residential properties sold last month increased 5.3 percent to $455,000, and the median price of a detached home during the same period increased 7.1 percent to $530,000
It was a positive sign to see an uptick in the number of residential listings hitting market, however, the total number of homes available for sale continues to perform well below historical averages. There were 585 homes listed in K-W and area last month, an increase of 25.5 percent compared to January of 2018. The number of active residential listings at the end of January totaled 810, which is 11.4 percent more than January of last year, but still well below the previous ten-year average of 1,189 listings for January. The average days it took to sell a home in January was 26 days, which is 5 days less than the amount of time it took in January 2018.
We have a positive outlook for 2019. I think we’re going to see home prices remain steady or have small increases, sales will continue to be strong but we’re also beginning to see more homes being listed for sale to increase our inventory and provide buyers with additional options. So long as everything else remains equal Waterloo Region should remain a strong and stable market.
If you have any questions or are thinking of buying or selling in the coming months, please give me a call at 519-497-4646 and we can sit down for a coffee and talk about some strategies that would work best for your family needs.
Have a great weekend!
Kevin
Kitchener Homes for sale -Teamwork
I am spending the day with my son at his school basketball tournament. It is interesting how a team of 12 and 13 year olds function as a team. Some teams work very well together. You can tell that they have been coached and taught the fundamentals of moving the ball, making crisp passes and taking good shots. On the other hand there are teams that are made up a 5 individuals all doing their own thing. They bring the ball in, run down the court with their head down and head straight toward the basket. They take some crazy shot which is nowhere near the basket. Then they proceed to run back on defence so that they are ready for the next turn to run down the court and do it all again.
As in life, the real estate business is much the same way. In order to have the proper outcome in a real estate transaction the Realtor must ensure that every team member is playing their appropriate position. Not unlike a point guard leading his team to victory, a Realtor must assume the lead and direct the players to get the desired result.
So if the realtor is the point guard then the shooting guard is the mortgage broker. The small forwards are the lawyers and appraisers and the center is the client. If you ever watch a great team perform, the focus is usually on the center when moving the ball down the court in order to score. He has the highest percentage of making the shot. If he has no shot he kicks the ball back out to the guard to put up the 3 pointer or reset for the next attempt to get the ball in the paint. Each member is doing their part to communicate and moving the ball around to get the score.
The center being the client, their role is get the house ready for sale, do the work of keeping it that way and ultimately scoring an offer that will result in the sale. It is the realtor’s job of leading this effort and providing information and direction to the rest of his team.
Another example would be a seller trying to sell their house themselves. One person has trouble playing two opposite positions, for example, center and point guard. It is impossible to bring the ball up the court as well as be there to receive the pass in the middle. They don’t have the experience or the mindset of the guard because their job is to be the center and take the ball to the hoop.
When a team is made up of 5 people all doing different things, not communicating with each other or one player is trying to play too many positions at once, the result is no basket and your back on defence. Only when the point guard(realtor) takes charge and makes all the pieces work as a unit, which ultimately keeps the ball moving thus end up with a result that is positive and worth the effort..
