
March Homes Sales up but Prices Dip in Waterloo Region
I hope you and your family are doing well. Looks like spring is here and Easter is just around the corner. The March stats are out and home sales are up over February, but prices have taken a small dip from the february average as well. Lets take a look at the numbers…
There were 725 residential homes sold in March 2022 is a decrease of 27.1 per cent compared to March 2021, which continues to hold the record for most home sales in a single month. On a month-over-month basis, sales in March were up 19.4 per cent compared to February 2022. The previous ten-year average number of residential sales for March is 599.
The skyrocketing prices of the last two months took a bit of a breather in March, with the overall average price dipping five per cent compared to what we saw in February. While it is too soon to draw conclusions from just one month of home sales, I know many will be comforted to see a leveling off on the average price, no matter how incremental.
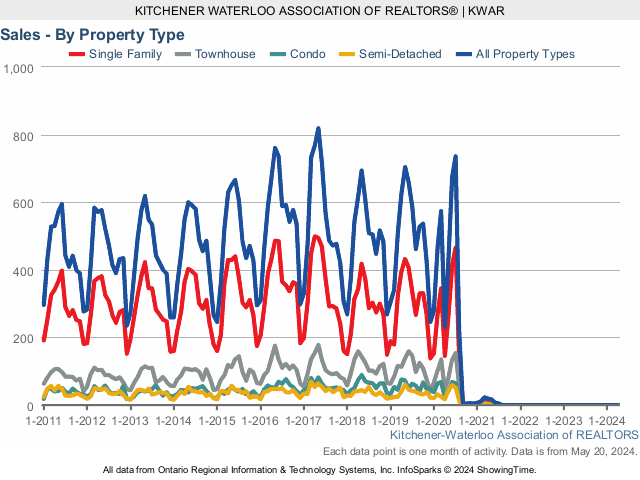
Total residential sales in March included 416 detached (down 29.7 per cent from March 2021), and 114 condominium units (down 9.5 per cent). Sales also included 64 semi-detached homes (down 17.9 per cent) and 131 townhouses (down 33.8 per cent).
In March, the average sale price for all residential properties in the Kitchener-Waterloo area was $960,181. This represents a 25.5 per cent increase over March 2021 and a 4.6 per cent decrease compared to February 2022.
- The average price of a detached home was $1,132,637. This represents a 25.9 per cent increase from March 2021 and a decrease 6.4 per cent compared to February 2022.

The MLS® HPI composite benchmark price for all residential properties in Kitchener-Waterloo was $960,100 in March. This represents a 29.6 per cent increase over March 2021 and a 1.5 per cent decrease compared to February 2022.
- The benchmark price for a detached home was $1,046,200. This represents a 28.1 per cent increase from March 2021 and 4.0 per cent decrease compared to February 2022.

Even though the average price decreased across all property types on a month-to-month basis, the MLS® HPI showed continued monthly gains for both townhouse and apartment property types. As the province feels its way out of the pandemic, we are beginning to see some very preliminary signs of a potential cooling. We are not seeing quite as many multiple offers and some offers are coming in with conditions. Of course, when we say cooling, we’re talking about a market that has been scorching hot which is why we are pleased to see this happening.
There were 1,131 new listings added last month, a decrease 16.8 per cent compared to the record topping number of listings added in March of last year, and a 28.0 per cent increase compared to the previous ten-year average for March.
The total number of homes available for sale in active status at the end of March was 441, an increase of 1.1 per cent compared to March of last year, and 59.0 per cent below the previous ten-year average of 1,072 listings for March.
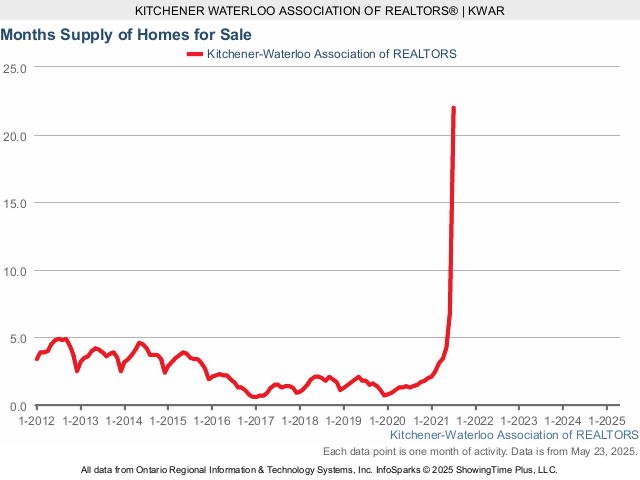
The number of months of inventory nudged up to 0.7 months in March from 0.5 months in February. Inventory has been under the one-month mark since October 2020. The number of months of inventory represents how long it would take to sell off current inventories at the current rate of sales.
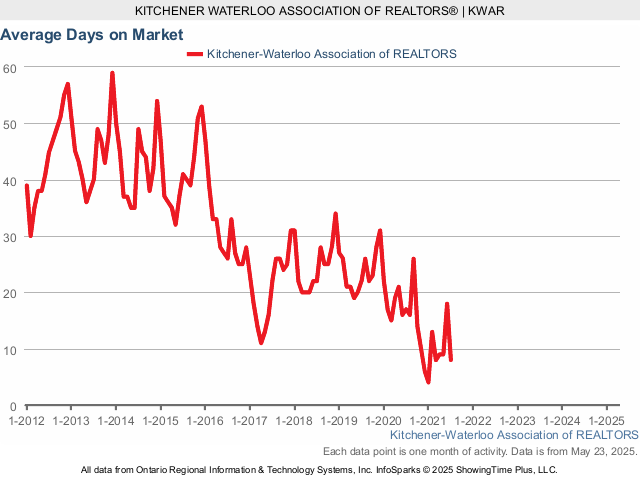
The average number of days to sell in March was 8 days, the same as it was in March 2021. The previous 5-year average is 16 days.
Historical Sales By Property Type

Months Supply of Homes for Sale

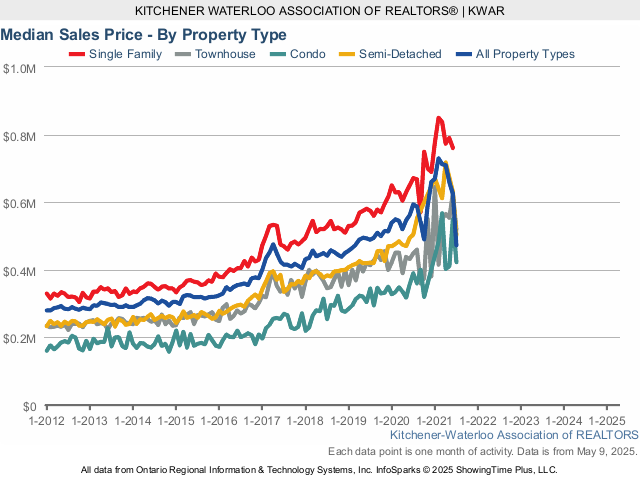
Historical Median Sales Price – By Property Type

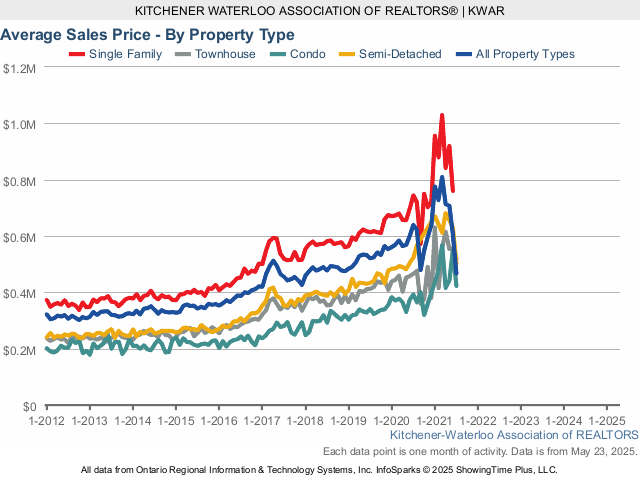
Historical Average Sales Price – By Property Type


If you are thinking of buying or selling this spring, wondering what the neighbor’s place sold for, or have any questions at all, give me a call, text at 519-497-4646 or shoot me an email to kevinbakerrealestate@gmail.com
Enjoy the nicer weather and have a wonderful Easter with your family!
Kevin
Euphoria Continues in the Kitchener Waterloo Housing Market.
Hope you and your family have been doing well and everyone is staying safe. With lockdowns being lifted in many regions across Ontario, everyone is trying to get back to a normal life again. I will say that lockdowns or not, the housing market is starting to experience a little bit of euphoria from buyers in my opinion and certainly speculative buying. With many buyers especially from the GTA looking for homes in our region, it is pushing prices up fast.
Lets look at the stats from February…
There were 597 residential homes sold, an increase of 27.8 per cent compared to February 2020, and an increase of 66.7 per cent compared to the previous month. The previous 10-year average number of residential sales for February is 407.
Total residential sales in February included 337 detached (up 23.9 per cent from February 2020), and 101 condominium units (up 57.8 per cent). Sales also included 47 semi-detached homes (up 46.9 per cent) and 112 townhouses (up 13.1 per cent).
In February, the average sale price of all residential properties sold in 2021 increased by 32.1 per cent to $752,289 compared to the same month last year. Meanwhile, the average price of a detached home hit yet another new milestone by exceeding 900-thousand-dollars for the first time, coming in at $910,126 an increase of 35.4 per cent. During this same period, the average sale price for an apartment-style condominium was $415,322 for an increase of 11.9 per cent. Townhomes and semis sold for an average of $609,566 (up 37.5 per cent) and $684,787 (up 41.1 per cent) respectively.
We are continuing to see a dramatic increases in the average price in February due to the persistent and fierce competition for homes in our region combined with short supply, this is frustrating buyers in the hyper competitive market.
The low inventory and mortgage rates are resulting in multiple offers, higher prices and creating a fear they are missing out on the chance to become homeowners in this unprecedented market.
The rise in the average price we’ve been tracking the past several months has included some exceptional sale prices. That’s why this month and going forward we will also be including the MLS® HPI to provide a clearer picture of our local housing market trends.
The MLS® HPI is a sophisticated statistical model and more stable price indicator than average or median price measures because it considers how the features of a home affects its price – such as age, number of bedrooms, and number of bathrooms.
The MLS® Home Price Index composite benchmark price for all residential properties in Kitchener-Waterloo was $709,600 in February. This represents a 27.9 per cent increase over February 2020 and a 5.6 per cent increase compared to January 2021.
The benchmark price for a detached home was $788,500. This represents a 28.8 per cent increase from February 2020 and 6.1 per cent increase compared to January 2021.
The benchmark price for an apartment-style condominium was $341,200. This represents a 13.9 per cent increase from February 2020 and a 0.1 per cent increase compared to January 2021.
The benchmark price for a townhouse is $526,700. This represents a 33.1per cent increase from February 2020 and a 6 per cent increase compared to January 2021.
There were 737 new listings added to the MLS® System in KW and area last month, an increase of 21 per cent compared to February of last year, and a 15.7 per cent increase compared to the previous ten-year average for February.
The total number of homes available for sale in active status at the end of February was 295, a decrease of 33.6 per cent compared to February of last year, and 73 per cent below the previous ten-year average of 1,096 listings for February.
The number of months of inventory was 0.5 in February and has numbered less than 1 month since October. The number of months of inventory represents how long it would take to sell off current inventories at the current rate of sales.
The average number of days to sell in February was 10 days, compared to 17 days in February 2020 and a previous 5-year average of 33 days.
If you are thinking of buying or selling in the coming months, wonder what the neighbor sold for, or have any questions at all, give me a call, text at 519-497-4646 or shoot me an email to kevinbaker@kwhometeam.ca.
Have a wonderful weekend and stay safe!
Kevin
It Was A Crazy January Real Estate Market in Kitchener Waterloo and Cambridge!
Hope you and your family have been doing well and everyone is staying safe. With the lockdowns in place and the kids home from school it is definitely a different winter season indeed. There is some great news though… the Waterloo Region real estate market is still on FIRE! The average price of a detached home in the region hits a new milstone… Breaking $800,000… WOW!!!
There were 351 residential homes sold in January, an increase of 24.9 per cent compared to January 2020, and an increase of 1.4 per cent compared to the previous month. The previous 10-year average number of residential sales for January is 286.
Total residential sales in January included 201 detached (up 31.3 per cent from January 2020), and 71 condominium units (up 97 per cent). Sales also included 21 semi-detached homes (unchanged) and 56 freehold townhouses (down 17.6 per cent).
In January, the average sale price of all residential properties sold in 2021 increased by 23.9 per cent to $695,582 compared to the same month last year. Meanwhile, the average price of a detached home hit a new milestone by exceeding 800-thousand-dollars for the first time, coming in at $853,945 an increase of 27.3 per cent. During this same period, the average sale price for an apartment-style condominium was $383,196 for a decrease of 1.4 per cent. Townhomes and semis sold for an average of $566,345 (up 29 per cent) and $626,512 (up 29.3 per cent) respectively.
The median price of all residential properties sold in January increased 25.9 per cent to $680,000 and the median price of a detached home during the same period increased 23.3 per cent to $801,500.
With demand for homes in the region very strong, the consumer preference is leaning predominantly toward single detached homes. In January we saw buyers paying a premium for this property type, Conversely, even as condo sales were increasing in January, we saw prices for this style of housing soften by comparison.
Supply is just not able to keep up with continuing demand, much of it coming from the GTA, for the strong increases in home prices in Waterloo Region and in many other parts across the province. The number of months of inventory in Waterloo region has numbered less than 1 month since October. The number of months of inventory represents how long it would take to sell off current inventories at the current rate of sales.
There were 432 new listings added to the MLS® System in KW and area last month, a decrease of 7.4 per cent compared to January of last year, and 37.6 per cent decrease compared to the previous ten-year average for January.
The average number of days to sell in January was 16 days, compared to 22 days in January 2020 and a previous 5-year average of 30 days

If you are thinking of buying or selling in the coming months, wonder what the neighbor sold for, or have any questions at all, give me a call, text at 519-497-4646 or shoot me an email to kevinbaker@kwhometeam.ca.
Have a wonderful weekend and stay safe!
Kevin
Home Sales Surge in July for Kitchener Waterloo and Cambridge
Hope you enjoyed a wonderful long weekend and the beautiful summer weather we have been having.
It was another crazy month for home prices here in Waterloo Region. Competition stays very high for buyers looking to lock down a house in July. With the rules around covid relaxing and more people getting out with Phase 3 opening the demand for homes has increased for sure.
There were 734 residential homes sold in July, an increase of 25.7 per cent compared to the same month last year, and well above the previous ten-year average for July of 531.
Total residential sales in July included 464 detached homes (up 39.3 per cent from July 2019), and 65 condominium apartments (up 3.2 per cent). Sales also included 153 townhouses (up 4.8 per cent) and 52 semi-detached homes (up 23.8 per cent).
The average sale price of all residential properties sold in July increased 22.8 per cent to $639,814 compared to the same month last year, while detached homes sold for an average price of $745,149 an increase of 21.4 per cent. During this same period, the average sale price for an apartment-style condominium was $392,770 for an increase of 15.2 per cent. Townhomes and semis sold for an average of $465,756 (up 12.8 per cent) and $522,872 (up 20.4 per cent) respectively.
The median price of all residential properties sold in July increased 21.7 per cent to $595,000 and the median price of a detached home during the same period increased 17.4 per cent to $675,000.
With mortgage rates near all time lows homebuyers remain very confident about owning a home in Waterloo Region and I expect this to contunie going into the fall.
There were 888 new listings added, an increase of 4.3 per cent compared to July of last year, and 15.5 per cent more than the previous ten-year average for July.
The total number of homes available for sale in active status at the end of July was 592, a decrease of 32.6 per cent compared to July of last year.
The number of Months Supply (also known as absorption rate) continues to be very low at just 1.3 months for the month of July, 27.8 per cent below the same period last year. The previous ten-year average supply of homes for July was 3.1 months, and in the past 5 years, the average supply for July was 2.1 months.
The average days to sell in July was 17 days, compared to 22 days in July 2019.
Historical Sales By Property Type

Months Supply of Homes for Sale
Historical Median Sales Price – By Property Type

Historical Average Sales Price – By Property Type

Historical Sales – By Price Range

If you are thinking of buying or selling in the coming months or have any questions at all, give me a call, text at 519-497-4646 or shoot me an email to kevinbaker@kwhometeam.ca Stay healthy and stay safe!
Have a great weekend!
Kevin
June Home Sales Spring Back and Prices Climb in Kitchener Waterloo
Hope you enjoyed a wonderful Canada Day, and are staying cool during our summer heat wave! The spring market may have been delayed due to Covid 19 but it has sprung back in a big way in June.
The number of homes sold in June shot up 57.6 per cent compared to May. There were 673 residential homes sold in June 2020, an increase of 2.1 per cent compared to June 2019, and an increase of 8.5 per cent compared to the previous 10-year average for June.
Total residential sales in June included 413 detached homes (up 1.7 per cent from June 2019), and 67 condominium apartments (up 36.7 per cent). Sales also included 134 townhouses (down 15.7 per cent) and 59 semi-detached homes (up 31.1 per cent).
Total residential sales during this second quarter (April, May, June) are down 33 per cent compared to last year. On a year-to-date basis, they are down 15.6 per cent.
I expect for the remainder of 2020 will see the number of home sales returning to near historical levels. There will be some catching up to do in the coming weeks, but I don’t think you will see the market taking the summer off.
The average sale price of all residential properties sold in June increased 12.8 per cent to $601,285 compared to the same month last year, while detached homes sold for an average price of $698,736 an increase of 13.2 per cent. During this same period, the average sale price for an apartment-style condominium was $372,392 for an increase of 13.2 per cent. Townhomes and semis sold for an average of $457,851 (up 11.4 per cent) and $504,816 (up 17.3 per cent) respectively.
The median price of all residential properties sold in June increased 14.4 per cent to $564,000 and the median price of a detached home during the same period increased 11.9 per cent to $650,000.
There were 920 new listings added in KW and area last month, the most added in a single month since May of last year, and 1.9 per cent more than the previous ten-year average for June.
The total number of homes available for sale in active status at the end of June was 640, a decrease of 28.7 per cent compared to June of last year.
The number of Months Supply (also known as absorption rate) continues to be very low at just 1.4 months for the month of June, 22.2 per cent below the same period last year. The previous ten-year average supply of homes for June was 3.22 months, and in the past 5 years, the average supply for June was 2.22 months.
The average days to sell in June was 16 days, compared to 20 days in June 2019.
Historical Sales By Property Type
Months Supply of Homes for Sale

Historical Median Sales Price – By Property Type
Historical Average Sales Price – By Property Type
Historical Sales – By Price Range


If you are thinking of buying or selling in the coming months or have any questions at all, give me a call, text at 519-497-4646 or shoot me an email to kevinbaker@kwhometeam.ca Stay healthy and stay safe!
Have a great week!
Kevin
May Home Sales Up Over April Here in Kitchener Waterloo
Well its been a crazy couple of months across the globe as well as here in Waterloo Region. The Real Estate Market slowed considerably in April, but has seemed to bounce back in May. Even though we are down 40.5 percent compared to May of last year, home sales are up 80 percent compared to April 2020 with 419 Residential homes sold through the MLS system.
Total residential sales in May included 255 detached homes (down 41 per cent from May 2019), and 42 condominium apartments (down 42.5 per cent). Sales also included 79 townhouses (down 42.8 per cent) and 43 semi-detached homes (down 29.5 per cent).
The average sale price of all residential properties sold in May increased 6.5 per cent to $568,275 compared to the same month last year, while detached homes sold for an average price of $657,274 an increase of 5.4 per cent. During this same period, the average sale price for an apartment-style condominium was $330,336 for an increase of 0.6 per cent. Townhomes and semis sold for an average of $454,197 (up 13 per cent) and $482,479 (up 11.4 per cent) respectively.
The median price of all residential properties sold in May increased 10.1 per cent to $545,000 and the median price of a detached home during the same period increased 9.6 per cent to $630,000.
The demand for homes in the Kitchener-Waterloo area is still very much alive, but as the virus continued to circulate in the community many would-be sellers were reluctant to put their homes on the market. For the homebuyers who cannot wait out the pandemic, they are not finding any fire sales as homes are not only maintaining their value, but also increasing.
There were 577 new listings added to the MLS® System in KW and area last month, a decrease of 48.7 per cent compared to May of 2019, far fewer than the previous 10-year average of 1,035 listings in May.
The total number of homes available for sale in active status at the end of May was 567, a decrease of 43.9 per cent compared to May of last year.
The number of Months Supply (also known as absorption rate) continues to be very low at just 1.3 months for the month of May, 38.1 per cent below the same period last year. The previous ten-year average supply of homes for May was 3.25 months, and in the past 5 years, the average supply for May was 2.32 months.
Yogi and I have addopted all the tools and technology to help both buyers and sellers stay safe during the pandemic, while helping people keep their plans intact. Our goal first and foremost is to keep everyone safe by limiting physical contact, practicing social distancing and keeping buyers showings limited to 3 people at a time with no children present during showings. We are here to help as life moves forward.
Here are some charts to on sales by type, months of supply and average prices.
Historical Sales by Property Type

Months Supply of Homes for Sale

Historical Median Sales Price – By Property Type

Historical Average Sales Price – By Property Type

Historical Sales – By Price Range


If you have any questions or concerns at all, give me a call or text at 519-497-4646 or shoot me an email to kevinbaker@kwhometeam.ca . Stay healthy and stay safe!
Have a great week!
Kevin
