
Record Low Home Sales in March for Waterloo Region
I hope you had a nice Easter long weekend with the family last week and got to enjoy some time together making new memories. The Easter bunny came to our place too in the form of 4 new chickens and 2 ducks for our newly constructed coop 🙂
The stats for March came out and Waterloo Region experienced record low home sales. The market is tight for inventory once again and multiple offers are showing up for well priced homes in the 700-900k range.
Let’s take a look at the numbers….
In March, a total of 596 homes were sold, this represents a decrease of 3.2% compared to the same period last year and a decline of 33.4% compared to the average number of homes sold in the previous 5 years for the same month.
Despite the challenging market conditions, the first quarter of 2024 saw an increase in home sales, marking an 8.0 per cent rise compared to the previous year. However, these figures still fall short of the first-quarter sales of the past decade.
While home sales in Waterloo Region hit a record low for March in over two decades, we’re also witnessing a positive trend. Over the past three months, prices and activity have started to pick up, and I expect this momentum will continue into the spring.
Total residential sales in March included 344 detached (down 3.9 per cent from March 2023), and 127 townhouses (down 0.8 per cent). Sales also included 86 condominium units (down 1.1 per cent) and 37 semi-detached homes (down 11.9 per cent).
In March, the average sale price for all residential properties in Waterloo Region was $806,279. This represents a 3.6 per cent increase compared to March 2023 and a 6.6 per cent increase compared to February 2024.
- The average price of a detached home was $954,342. This represents a 4.9 per cent increase from March 2023 and an increase of 7.3 per cent compared to February 2024.
- The average sale price for a townhouse was $667,810. This represents a 4.4 per cent increase from March 2023 and an increase of 6.0 per cent compared to February 2024.
- The average sale price for an apartment-style condominium was $483,085. This represents an increase of 0.3 per cent from March 2023 and an increase of 5.3 per cent compared to February 2024.
- The average sale price for a semi was $680,039. This represents a decrease of 2.9 per cent compared to March 2023 and an increase of 1.0 per cent compared to February 2024.
Average Sale Price – Monthly

| MLS® Home Price Index Benchmark Price | ||||||
| Kitchener-Waterloo | Cambridge | |||||
| Benchmark Type: | March 2024 | Monthly % Change | Yr./Yr. % Change | March 2024 | Monthly % Change | Yr./Yr. % Change |
| Composite | $740,900 | 1.6 | 0.0 | $747,500 | 0.7 | 0.9 |
| Detached | $853,800 | 1.5 | 1.3 | $780,100 | 0.8 | 1.1 |
| Townhouse | $614,900 | 2.3 | 1.3 | $652,400 | 0.6 | 2.4 |
| Apartment | $461,900 | 2.1 | -0.7 | $490,500 | 2.8 | 3.4 |

Home prices have been gradually increasing since December, which is a typical trend that we see going into a spring market. The rate and extent of further increases will depend on the willingness and patience of potential home buyers who have been waiting for lower interest rates before making their purchase. With the Bank of Canada not anticipated to make any rate changes before its June meeting, some potential home buyers may feel stuck in limbo.
There were 1,023 new listings added last month, an increase of 18.7 per cent compared to March last year and a 15.9 percent decrease compared to the previous ten-year average for March.
The total number of homes available for sale in active status at the end of March was 1,081 an increase of 54.0 per cent compared to March of last year and 1.1 per cent below the previous ten-year average of 1,093 listings for March.
At the end of March, there were 1.9 months of inventory, a 58.3 percent increase compared to last year and 18.8 percent above the previous 10-year average. The number of months of inventory represents how long it would take to sell off current inventories at the current sales rate.
The average number of days to sell in March was 19, the same number as March 2023. The previous 5-year average was 18 days.
If you are thinking about buying a new home, It is my belief that we are going to see home prices rise throughout 2024 and once the Bank of Canada starts lowering rates the acceleration of prices will increase as buyers that have been sitting on the sidelines will jump back into the market.
If you have any questions at all, are thinking of making a move this spring and wondering what your home might be worth, give me a call or text to 519-497-4646 and we can sit down for a coffee and chat about your family’s needs going forward.
Enjoy the rest of your April and the nice weather that is coming.
Kevin
Average Sales Price – Municipality

Average Sales Price – Township

Monthly Sales By Property Type

Monthly Supply of Homes for Sale

Monthly Supply of Homes for Sale – By Property Type

Monthly Median Sales Price – By Property Type

Monthly Average Sales Price – By Property Type

Monthly Average Days on Market

Homes Sales Decline Significantly here in Waterloo Region.
Happy New Year!! I hope that you enjoyed the holiday season and made some wonderful memories with your families. Unfortunatley it was not a white Christmas but I know those skiers out there are anxiously awaiting the snow to arrive so they can hit the slopes.
The stats are out for 2023 and the market definitly struggled in the sales catagory. With interest rates at 20 year highs and inventory still tight it kept prices relativly stable but sales down significantly. Lets take a look at the stats….
There were 6,623 homes sold in 2023, a decrease of 14.8 per cent compared to 2022, and a decline of 23.2 per cent compared to the previous 5-year average for annual sales.
On a monthly basis, there were 285 homes sold in December, a decrease of 0.7 per cent compared to December 2022, and 25.6 per cent below the previous 5-year average for the month.
It should not be a surprise to anyone that for the second year in a row, the housing market in Waterloo Region has been affected by higher interest rates, resulting in a significant decline in annual sales. This year’s sales reached their lowest point in over two decades.
The trend observed in December reflects the overall slowdown in home sales throughout the year, with sales falling behind historical levels. The last time annual sales in Waterloo Region recorded fewer than 7,000 units was the year 2000.
Total residential sales in December included 172 detached (up 3.6 per cent from December 2022), and 54 townhouses (down 6.9 per cent). Sales also included 35 condominium units (up 2.9 per cent) and 24 semi-detached homes (down 4.0 per cent).
For 2023, total residential sales included 3,901 detached (down 17.0 per cent), and 1,339 townhouses (down 6.5 per cent). Sales also included 904 condominium units (down 9.2 per cent) and 457 semi-detached homes (down 26.6 per cent).
In December, the average sale price for all residential properties in Waterloo Region was $740,697. This represents a 2.8 per cent increase compared to December 2022 and a 2.1 per cent decrease compared to November 2023.
- The average price of a detached home was $848,151. This represents a 2.6 per cent increase from December 2022 and a decrease of 4.7 per cent compared to November 2023.
- The average sale price for a townhouse was $617,023. This represents a 0.8 per cent increase from December 2022 and an increase of 1.2 per cent compared to November 2023.
- The average sale price for an apartment-style condominium was $490,816. This represents a 5.0 per cent increase from December 2022 and an increase of 9.0 per cent compared to November 2023.
- The average sale price for a semi was $613,283. This represents a decrease of 0.5 per cent compared to December 2022 and a decrease of 0.5 per cent compared to November 2023.
Average Sale Price – Monthly

On a year-to-date basis, the average sale price for all residential properties in Waterloo Region decreased 7.7 per cent to $786,033 compared to 2022.
- The year-to-date average price of a detached home was $917,907. This represents a 6.1 per cent decrease compared to 2022.
- The year-to-date average sale price for a townhouse was $653,138. This represents a 9.0 per cent decrease compared to 2022.
- The year-to-date average sale price for an apartment-style condominium was $481,877. This represents a 9.0 per cent decrease compared to 2022.
- The year-to-date average sale price for a semi was $677,831. This represents a decrease of 7.9 per cent compared to 2022.
Average Sales Price – Year-to-date
")
| Monthly MLS® Home Price Index Benchmark Price | ||||||
| Kitchener-Waterloo | Cambridge | |||||
| Benchmark Type: | December 2023 | Monthly % Change | Yr./Yr. % Change | December 2023 | Monthly % Change | Yr./Yr. % Change |
| Composite | $705,700 | -0.4 | -1.4 | $706,800 | -2.5 | -0.4 |
| Detached | $798,100 | -0.6 | -0.9 | $727,000 | -2.9 | -0.8 |
| Townhouse | $602,000 | -2.2 | 0.0 | $657,500 | -1.2 | 3.8 |
| Apartment | $471,800 | 3.5 | 2.0 | $497,700 | 1.1 | 1.6 |
| Annual MLS® Home Price Index Benchmark Price | ||||
| Kitchener-Waterloo | Cambridge | |||
| Benchmark Type: | 2023 | Yr./Yr. % Change | 2023 | Yr./Yr. % Change |
| Composite | $746,600 | -9.9 | $753,500 | -9.5 |
| Detached | $848,900 | -8.5 | $784,200 | -9.1 |
| Townhouse | $624,200 | -10.8 | $655,600 | -10.5 |
| Apartment | $475,500 | -8.7 | $485,900 | -11.1 |
")
The region’s slowing housing market echoes the overall slowdown we are seeing in the broader economy.
There were 287 new listings added last month, a decrease of 6.2 per cent compared to December of last year and a 17.9 per cent decrease compared to the previous ten-year average for December.
In 2023, 11,528 new listings were added, a decrease of 14.4 per cent compared to 2022, and a 4.4 per cent decrease compared to the previous ten-year annual average.
The total number of homes available for sale in active status at the end of December was 779, an increase of 36.0 per cent compared to December of last year and 5.8 per cent above the previous ten-year average of 736 listings for December.
The number of months of inventory is up 55.6 per cent compared to December of last year, but still historically low at 1.4 months. Between 2010 and 2015, December’s rolling 12-month average was 3.5 months. The number of months of inventory represents how long it would take to sell off current inventories at the current sales rate.
The average number of days to sell in December was 30, compared to 25 days in December 2022. The previous 5-year average is 23 days.
The average days to sell in 2023 was 19 days, compared to 14 days in 2022 and a previous 5-year average of 18 days.
If you have any questions, wondering what the home down the street sold for or are thinking of making a move in the coming months, feel free to give me a call or text at 519-497-4646 or email Kevinbakerrealestate@gmail.com and we can set up a time to get together for a coffe and discuss your families plans.
Have a great January
Kevin
Average Sales Price – Municipality

Average Sales Price – Township

Monthly Sales By Property Type

Monthly Supply of Homes for Sale

Monthly Median Sales Price – By Property Type

Monthly Average Sales Price – By Property Type

Monthly Average Days on Market
Listing Inventory Up for July in Waterloo Region
I hope you are having an amazing long weekend. The rain has put a bit of a damper on things but overall the weather this summer has been wondeful. I know the crops and my grass have never looked so good!
The numbers are out for July in the Kitchener Waterloo and Cambridge real estate markets and things are looking good. Listing inventory is gaining steam as well as single detached home prices. The townhouse and condo markets are still struggling a bit but overall moving up over last month. Lets take a look at the numbers…
In July, there were 607 homes sold, representing an increase of 10.4 per cent compared to the previous year and a decline of 21.6 per cent compared to the previous 5-year average for the month.
The Waterloo Region residential real estate market experienced some growth in terms of unit sales and supply in July, with home prices showing moderate fluctuations, despite the Bank of Canada’s most recent interest rate hike, we saw more sellers coming off the sidelines with new listing activity reaching its second highest level for the month of July in over a decade.
Total residential sales in July included 364 detached (up 8.3 per cent from July 2022), and 120 townhouses (up 7.1 per cent). Sales also included 74 condominium units (up 15.6 per cent) and 44 semi-detached homes (up 22.2 per cent).
In July, the average sale price for all residential properties in Waterloo Region was $795,778. This represents a 5.8 per cent increase compared to July 2022 and a 5.2 per cent decrease compared to June 2023.
- The average price of a detached home was $920,635. This represents an 8.8 per cent increase from July 2022 and a decrease of 8.4 per cent compared to June 2023.
- The average sale price for a townhouse was $670,283. This represents a 4.4 per cent increase from July 2022 and an increase of 0.5 per cent compared to June 2023.
- The average sale price for an apartment-style condominium was $496,757. This represents a decrease of 4.8 per cent from July 2022 and an increase of 5.6 per cent compared to June 2023.
- The average sale price for a semi was $665,328. This represents an increase of 0.6 per cent compared to July 2022 and a decrease of 3.8 per cent compared to June 2023.

| MLS® Home Price Index Benchmark Price | ||||||
| Kitchener-Waterloo | Cambridge | |||||
| Benchmark Type: | July 2023 | Monthly % Change | Yr./Yr. % Change | July 2023 | Monthly % Change | Yr./Yr. % Change |
| Composite | $765,000 | -1.7 | 1.8 | $764,600 | -1.8 | -1.2 |
| Detached | $869,000 | -2.3 | 4.4 | $797,100 | -2.2 | 1.2 |
| Townhouse | $648,700 | 0.6 | -0.3 | $663,200 | 0.5 | -11.9 |
| Apartment | $484,900 | 1.2 | -5.5 | $492,600 | 2.2 | -14.8 |

In this ever-evolving market, demand persists despite the changing landscape. Increased listing activity is certainly welcomed to help offset the lack of supply and pent-up demand.
There were 1,194 new listings added last month, an increase of 1.4 per cent compared to July of last year and a 10.8 per cent increase compared to the previous ten-year average for July.
The total number of homes available for sale in active status at the end of July was 1,107, a decrease of 14.8 per cent compared to July of last year and 22.6 per cent below the previous ten-year average of 1431 listings for July.
There were 2.0 months of inventory at the end of July, up slightly from the end of June and in line with the previous 10-year average. The number of months of inventory represents how long it would take to sell off current inventories at the current sales rate.
The average number of days to sell in July was 16, compared to 18 days in July 2022. The previous 5-year average is 18 days.
Average Sales Price – Municipality

Average Sales Price – Township

Monthly Sales By Property Type

Monthly Supply of Homes for Sale

Monthly Median Sales Price – By Property Type

Monthly Average Sales Price – By Property Type

Monthly Average Days on Market

If you are thinking of buying or selling this fall, wondering what the neighbor’s place sold for, or have any questions at all, give me a call, text at 519-497-4646 or shoot me an email to kevinbakerrealestate@gmail.com
Enjoy the rest of your holiday Monday!
Kevin
Home Sales and Prices Both Up for July in Waterloo Region
Hope all is well with you and your family. Summer is here and I hope that you have been able to get out and enjoy some of the great weather we have had lately.
The market stats are out for June, lets take a look and see where things are at…
In June, there were 780 homes sold, representing an increase of 4.6 per cent compared to the previous year and a decline of 12.3 per cent compared to the previous 5-year average for the month.
The real estate market in Waterloo Region showed signs of a rebound in June, with monthly sales increasing on a year-over-year basis for the first time this year. The total number of home sales are down nearly 25 per cent for the first half of 2023 compared to last year but have been steadily climbing since January.
Total residential sales in June included 468 detached (up 5.9 per cent from June 2022), and 149 townhouses (up 4.9 per cent). Sales also included 118 condominium units (up 22.9 per cent) and 42 semi-detached homes (down 32.3 per cent).
In June, the average sale price for all residential properties in Waterloo Region was $839,869. This represents a 6.4 per cent increase compared to June 2022 and a 2.0 per cent increase compared to May 2023.
- The average price of a detached home was $1,005,519. This represents a 10.4 per cent increase from June 2022 and an increase of 4.1 per cent compared to May 2023.
- The average sale price for a townhouse was $665,984. This represents a 0.2 per cent increase from June 2022 and a decrease of 4.4 per cent compared to May 2023.
- The average sale price for an apartment-style condominium was $470,163. This represents a decrease of 6.2 per cent from June 2022 and a decrease of 3.3 per cent compared to May 2023.
- The average sale price for a semi was $691,507. This represents a decrease of 1.1 per cent compared to June 2022 and a decrease of 5.0 per cent compared to May 2023.

| MLS® Home Price Index Benchmark Price | ||||||
| | Kitchener-Waterloo | Cambridge | ||||
| Benchmark Type: | June 2023 | Monthly % Change | Yr./Yr. % Change | June 2023 | Monthly % Change | Yr./Yr. % Change |
| Composite | $777,800 | 0.1 | -2.0 | $778,600 | -1.6 | -3.4 |
| Detached | $889,400 | 0.2 | 0.7 | $815,300 | -1.9 | -1.0 |
| Townhouse | $645,200 | 1.7 | -5.9 | $660,100 | 1.2 | -14.7 |
| Apartment | $479,000 | -1.8 | -8.7 | $481,900 | 0.2 | -16.6 |

In June we saw robust demand for detached properties, driving a significant 10.5 per cent increase in the average sale price of a detached home, while the central bank raised its benchmark interest rate to 4.75 per cent near the beginning of the month, demand remains strong. Buyers and sellers can expect a competitive market as the number of homes for sale continues to be well below the long-term average.
There were 1,321 new listings added last month, a decrease of 21.6 per cent compared to June of last year and a 3.5 per cent increase compared to the previous ten-year average for June.
The total number of homes available for sale in active status at the end of June was 1007, a decrease of 23.1 per cent compared to June of last year and 32.8 per cent below the previous ten-year average of 1499 listings for June.
The number of months of inventory is up 5.9 per cent compared to June of last year, but still historically low at 1.8 months. The number of months of inventory represents how long it would take to sell off current inventories at the current sales rate.
The average number of days to sell in June was 15, compared to 13 days in June 2022. The previous 5-year average is 17 days.
Average Sales Price – Municipality

Average Sales Price – Township

Monthly Sales By Property Type

Monthly Supply of Homes for Sale

Monthly Median Sales Price – By Property Type

Monthly Average Sales Price – By Property Type

Monthly Average Days on Market

If you are thinking of buying or selling this summer/fall, wondering what the neighbor’s place sold for, or have any questions at all, give me a call, text at 519-497-4646 or shoot me an email to kevinbakerrealestate@gmail.com
Enjoy the great July weather!
Kevin
Home Prices Edging up in Waterloo Region
Hope all is well with you and your family. It looks like spring is here and hopefully the nicer weather will be here to stay very soon. Taking a look at the Waterloo Region Real Estate Market, sales are still down but prices are edging up mostly due to the tightening of inventory once again. The GTA buyers have returned as well which is providing increased demand for housing. Lets take a look at the stats….
Sales volume remained subdued last month, with 670 homes sold in April, representing a decrease of 22.0 per cent compared to April 2022 and 18.0 percent below the previous 5-year average for the month.
The local spring market is off to a slower than usual start with half the number of new listings hitting the market than this time last year. However, with demand continuing to outstrip supply, we saw prices increase on a month-over-month basis as total sales volume continues to waver well below historical figures for the month of April.
Total residential sales in April included 404 detached (down 22.8 per cent from April 2022), and 119 townhouses (down 20.7 per cent). Sales also included 95 condominium units (down 18.1 per cent) and 51 semi-detached homes (down 25.0 per cent).
In April, the average sale price for all residential properties in Waterloo Region was $797,716. This represents an 11.9 per cent decrease compared to April 2022 and a 2.6 per cent increase compared to March 2023.
- The average price of a detached home was $925,219. This represents a 10.7 per cent decrease from April 2022 and an increase of 1.7 per cent compared to March 2023.
- The average sale price for a townhouse was $664,519. This represents a 12.7 per cent decrease from April 2022 and an increase of 3.9 per cent compared to March 2023.
- The average sale price for an apartment-style condominium was $488,971. This represents a decrease of 18.3 per cent from April 2022 and an increase of 1.5 per cent compared to March 2023.
- The average sale price for a semi was $686,792. This represents a decrease of 10.1 per cent compared to April 2022 and a decrease of 1.9 per cent compared to March 2023.

| MLS® Home Price Index Benchmark Price | ||||||
| Kitchener-Waterloo | Cambridge | |||||
| Benchmark Type: | April 2023 | Monthly % Change | Yr./Yr. % Change | April 2023 | Monthly % Change | Yr./Yr. % Change |
| Composite | $759,600 | 2.7 | -14.7 | $774,500 | 3.8 | -12.8 |
| Detached | $865,100 | 3.0 | -13.0 | $809,300 | 4.3 | -12.0 |
| Townhouse | $611,600 | 1.9 | -20.3 | $647,000 | 0.8 | -17.1 |
| Apartment | $484,900 | 2.3 | -13.4 | $491,900 | 1.8 | -16.0 |

Waterloo Region remains a sellers’ market, and while prices have fallen in comparison to last year, we anticipate that home prices will continue to increase steadily. Some stability in mortgage rates has brought about a return of buyer activity as we begin to observe a return of multiple offer scenarios, bidding wars, and a decrease in the number of days properties take to sell.
There were 869 new listings added last month, a decrease of 49.4 per cent compared to April of last year and a 33.2 per cent decrease compared to the previous ten-year average for April.
The total number of homes available for sale in active status at the end of April was 703, a decrease of 25.9 per cent compared to April of last year and 49.7 per cent below the previous ten-year average of 1397 listings for April.
The number of months of inventory is up 8.3 per cent compared to April of last year, but still historically low at 1.3 months. The number of months of inventory represents how long it would take to sell off current inventories at the current sales rate.
The average number of days to sell in April was 16, compared to 9 days in April 2022. The previous 5-year average is 16 days.
Average Sales Price – Municipality

Average Sales Price – Township

Monthly Sales By Property Type

Monthly Supply of Homes for Sale

Monthly Median Sales Price – By Property Type

Monthly Average Sales Price – By Property Type

Monthly Average Days on Market

The Real Estate market is changing very quickly, so If you are thinking of buying or selling this spring or summer, wondering what the neighbor’s place sold for, or have any questions at all, give me a call, text at 519-497-4646 or shoot me an email to kevinbakerrealestate@gmail.com
Enjoy a wonderful May and Happy Early Mothers Day to all the Mom’s!
Kevin
February Sales Down but Prices Remain Steady
I hope you and your family are enjoying a wonderful weekend and survived the house dumping of snow we received last night. The February Real Estate stats are out for Waterloo region and inventory is tight and sales continue to stay low as prices are remaining steady. Lets take a look at the numbers…
Sales volume set a new low for the month of February, with 439 homes sold, representing a decrease of 45.0 per cent compared to February 2022 and 31.5 per cent below the previous 5-year average for the month.
Once again, we experienced record low listing sales in February, Increased borrowing costs, coupled with a shortage of housing supply and strong demand, have put a strain on prospective buyers as affordability continues to be a top concern; however, home prices have remained stable for the past several months.
Total residential sales in February included 256 detached (down 45.3 per cent from February 2022), and 100 townhouses (down 33.3 per cent). Sales also included 55 condominium units (down 52.6 per cent) and 28 semi-detached homes (down 56.3 per cent).
In February, the average sale price for all residential properties in Waterloo Region was $758,698. This represents a 25.1 per cent decrease compared to February 2022 and a 0.6 per cent decrease compared to January 2023.
- The average price of a detached home was $877,884. This represents a 26.0 per cent decrease from February 2022 and a decrease 0.9 per cent compared to January 2023.
- The average sale price for a townhouse was $642,777. This represents a 25.6 per cent decrease from February 2022 and an increase of 2.7 per cent compared to January 2023.
- The average sale price for an apartment-style condominium was $461,322. This represents a decrease of 19.2 per cent from February 2022 and a decrease of 6.9 per cent compared to January 2023.
- The average sale price for a semi was $667,250. This represents a decrease of 25.8 per cent compared to February 2022 and an increase of 2.6 per cent compared to January 2023.

| MLS® Home Price Index Benchmark Price | ||||||
| Kitchener-Waterloo | Cambridge | |||||
| Benchmark Type: | February 2023 | Monthly % Change | Yr./Yr. % Change | February 2023 | Monthly % Change | Yr./Yr. % Change |
| Composite | $726,500 | 3.0 | -24.2 | $742,300 | 1.6 | -25.3 |
| Detached | $822,800 | 4.2 | -24.8 | $770,800 | 1.8 | -27.0 |
| Townhouse | $588,500 | 0.9 | -22.3 | $637,400 | -0.2 | -13.8 |
| Apartment | $473,800 | -1.6 | -14.3 | $492,100 | 0.9 | -7.6 |

Limited supply and the small number of listings coming to the market continues to be a trend within the region. There may be some hesitation for those considering selling their property due to decreased reported sale prices; however, with demand continuing to outpace supply and prices stabilizing, sellers are in a healthy position to make their move coming into a spring market.
Although prices have fallen more than 20 per cent from their peak in February 2022, they remain significantly higher than three years ago, which is great news for our local market.
There were 671 new listings added last month, a decrease of 37.1 per cent compared to February of last year and a 24.8 per cent decrease compared to the previous ten-year average for February.
The total number of homes available for sale in active status at the end of February was 692, an increase of 75.2 per cent compared to February of last year and 38.0 per cent below the previous ten-year average of 1117 listings for February.
The number of months of inventory is up 140.0 per cent compared to February of last year, but still historically low at 1.2 months. The number of months of inventory represents how long it would take to sell off current inventories at the current sales rate.
The average number of days to sell in February was 20, compared to 8 days in February 2022. The previous 5-year average is 16 days.
Average Sales Price – Municipality

Average Sales Price – Township

Monthly Sales By Property Type

Monthly Supply of Homes for Sale

Monthly Median Sales Price – By Property Type

Monthly Average Sales Price – By Property Type

Monthly Average Days on Market

The Real Estate market is changing very quickly, so If you are thinking of buying or selling this spring, wondering what the neighbor’s place sold for, or have any questions at all, give me a call, text at 519-497-4646 or shoot me an email to kevinbakerrealestate@gmail.com
Enjoy a wonderful March with your families!
Kevin
Homes Sales 2nd Lowest in Over a Decade Here is Kitchener Waterloo and Cambridge
I hope you and your family are enjoying a wonderful weekend and staying warm. This cold snap certainly has been a frigid one! The January Real Estate stats are out for Waterloo region and inventory is tight and sales are low to start the year. Lets break things down…
The number of homes sold last month totalled 297 units, a decrease of 41.9 per cent compared to January 2022 and 31.0 per cent below the previous 5-year average for the month.
Waterloo Region’s home sales in January were at their second lowest of any single month in well over a decade, home sales tend to be sluggish in January, and while we expected activity to ease to reflect economic challenges, this was a larger drop than originally anticipated.
Total residential sales in January included 176 detached (down 38.5 per cent from January 2022), and 61 townhouses (down 44.5 per cent). Sales also included 43 condominium units (down 48.2 per cent) and 17 semi-detached homes (down 46.9 per cent).
In January, the average sale price for all residential properties in Waterloo Region was $764,063. This represents a 20.1 per cent decrease compared to January 2022 and a 5.9 per cent increase compared to December 2022.
- The average price of a detached home was $888,487. This represents a 21.5 per cent decrease from January 2022 and an increase of 7.6 per cent compared to December 2022.
- The average sale price for a townhouse was $625,831. This represents a 26.1 per cent decrease from January 2022 and an increase of 2.2 per cent compared to December 2022.
- The average sale price for an apartment-style condominium was $495,753. This represents a decrease of 9.3 per cent from January 2022 and an increase of 6.1 per cent compared to December 2022.
- The average sale price for a semi was $650,588. This represents a decrease of 21.5 per cent compared to January 2022 and an increase of 5.5 per cent compared to December 2022.

| MLS® Home Price Index Benchmark Price | ||||||
| Kitchener-Waterloo | Cambridge | |||||
| Benchmark Type: | January 2023 | Monthly % Change | Yr./Yr. % Change | January 2023 | Monthly % Change | Yr./Yr. % Change |
| Composite | $705,100 | -1.2 | -23.7 | $731,000 | 2.4 | -21.3 |
| Detached | $789,900 | -1.4 | -25.9 | $757,200 | 2.9 | -23.2 |
| Townhouse | $583,100 | -1.8 | -17.6 | $638,300 | -0.2 | -8.0 |
| Apartment | $481,300 | 2.0 | -5.1 | $487,600 | -1.9 | -4.3 |

On a monthly basis, we saw the average sale price increase across all property types in January and I’m also noticing more multiple offers happening, especially on detached homes that are priced under eight hundred thousand dollars.
Meanwhile, the Bank of Canada again increased interest rates at the end of January by 25 basis points to 4.5 per cent. While not a huge increase, the continuance of interest rate hikes is an ongoing factor in the reduction of home sales within the market.
There were 579 new listings added last month, a decrease of 13.3 per cent compared to January of last year and a 28.7 per cent decrease compared to the previous ten-year average for January.
The total number of homes available for sale in active status at the end of January was 651, an increase of 167.9 per cent compared to January of last year and 34.7 per cent below the previous ten-year average of 998 listings for January.
The number of months of inventory is up 233.3 per cent compared to January of last year, but still historically low at one month. Between 2011 and 2015, January’s average months of inventory was 3.0 months. The number of months of inventory represents how long it would take to sell off current inventories at the current sales rate.
The average number of days to sell in January was 25, compared to 9 days in January 2022. The previous 5-year average is 21 days.
While the inventory levels are low, we are starting to see the GTA buyers come back to our local market after those buyers really subsided in the middle to later half of 2022. That is creating multiple offers once again and pushing prices back up in the short term.
Average Sales Price – Municipality

Average Sales Price – Township

Monthly Sales By Property Type

Monthly Supply of Homes for Sale

Monthly Median Sales Price – By Property Type

Monthly Average Sales Price – By Property Type

Monthly Average Days on Market

The Real Estate market is changing very quickly, so If you are thinking of buying or selling this spring, wondering what the neighbor’s place sold for, or have any questions at all, give me a call, text at 519-497-4646 or shoot me an email to kevinbakerrealestate@gmail.com
Enjoy a wonderful February!
Kevin
Home Prices Continue to Cool in Kitchener Waterloo and Cambridge
I hope you and your family are starting to enjoy the holiday season. It’s wonderful that everyone can get together again and make new memories. Let’s hope that the snow stays away just a little longer but arrives just in time for Christmas!
The latest housing stats are out for Waterloo Region, lets take a look at what the numbers have to say…
There were 453 homes sold in November, a decrease of 43.7 per cent compared to November 2021 and 34.2 per cent below the previous 5-year average for the month.
Total residential sales in November included 280 detached (down 38.3 per cent from November 2021), and 78 townhouses (down 57.1 per cent). Sales also included 58 condominium units (down 49.6 per cent) and 37 semi-detached homes (down 28.8 per cent).
As they traditionally do at this time of year, home sales have decreased, at the same time, we know ever-increasing homeownership costs are contributing to the decline and putting downward pressure on sales prices which have plateaued since July.
In November, the average sale price for all residential properties in Waterloo Region was $736,024. This represents a 10.4 per cent decrease compared to November 2021 and a 3.6 per cent decrease compared to October 2022.
- The average price of a detached home was $838,609. This represents a 13.1 per cent decrease from November 2021 and a decrease of 3.5 per cent compared to October 2022.
- The average sale price for a townhouse was $618,669. This represents a 12.3 per cent decrease from November 2021 and a decrease of 2.6 per cent compared to October 2022.
- The average sale price for an apartment-style condominium was $458,384. This represents a decrease of 7.5 per cent from November 2021 and a decrease of 6.2 per cent compared to October 2022.
- The average sale price for a semi was $642,328. This represents a decrease of 9.4 per cent compared to November 2021 and an increase of 3.2 per cent compared to October 2022.

| MLS® Home Price Index Benchmark Price | ||||||
| Kitchener-Waterloo | Cambridge | |||||
| Benchmark Type: | November 2022 | Monthly % Change | Yr./Yr. % Change | November 2022 | Monthly % Change | Yr./Yr. % Change |
| Composite | $711,200 | -1.7 | -12.8 | $744,200 | 1.8 | -10.6 |
| Detached | $791,000 | -2.1 | -14.8 | $770,600 | 2.5 | -12.0 |
| Townhouse | $602,200 | -0.2 | -7.0 | $652,000 | -1.7 | -2.0 |
| Apartment | $492,600 | -0.4 | 8.0 | $504,100 | -3.1 | 3.7 |

The Waterloo Region market has been moving towards more of a balanced market throughout the latter part of the year, and November has followed that trend. We have a long way to go before the pendulum swings into it being a buyer’s market. However, if the Bank of Canada yet again raises its key interest rate on December 7, it is likely to result in fewer buyers competing for more inventory.
There were 752 new listings added last month, a decrease of 6.6 per cent compared to November of last year and a 1.3 per cent increase compared to the previous ten-year average for November.
The total number of homes available for sale in active status at the end of November was 860, an increase of 209.4 per cent compared to November of last year and 29.9 per cent below the previous ten-year average of 1227 listings for November.
The number of months of inventory is up 333.3 per cent compared to November of last year, but still historically low at 1.3 months. Between 2009 and 2015, November’s average months of inventory was 3.2 months. The number of months of inventory represents how long it would take to sell off current inventories at the current sales rate.
The average number of days to sell in November was 21, compared to 10 days in November 2021. The previous 5-year average is 21 days.
Average Sales Price – Municipality

Average Sales Price – Township

Monthly Sales By Property Type

Monthly Supply of Homes for Sale

Monthly Median Sales Price – By Property Type

Monthly Average Sales Price – By Property Type

Monthly Average Days on Market

If you are thinking of buying or selling in the next few months or into to spring of 2023, wondering what the neighbor’s place sold for, or have any questions at all, give me a call, text at 519-497-4646 or shoot me an email to kevinbakerrealestate@gmail.com
Enjoy a wonderful holiday season with your family and friends!
Kevin
Home Sales Continue to Slow in Waterloo Region
I hope you and your family enjoyed a great Halloween. Even with the rain I heard there were plenty of little ones out having fun! Fall is certainly here and the leave piles are growing although we really can’t complain about the weather, its been so nice out lately.
The latest housing stats are out for Waterloo Region, lets take a look at what the numbers have to say…
There were 491 residential homes were sold last month, a decrease of 39.7 per cent compared to October 2021 and 36.2 per cent below the previous 5-year average for the month.
Total residential sales in October included 310 detached (down 38.2 per cent from October 2021), and 84 townhouses (down 45.1 per cent). Sales also included 64 condominium units (down 36.0 per cent) and 31 semi-detached homes (down 47.5 per cent).
The pace of home sales continued to slow in October after the Bank of Canada’s sixth straight interest rate hike in September. Faced with higher borrowing costs, some buyers have had to re-assess what they can afford. As these buyers get moved to the sidelines, sellers question if now is the best possible time to sell.
In October, the average sale price for all residential properties in Waterloo Region was $763,630. This represents an 8.4 per cent decrease compared to October 2021 and a 1.6 per cent increase compared to September 2022.
- The average price of a detached home was $860,568. This represents a 10.6 per cent decrease from October 2021 and a decrease of 0.3 per cent compared to September 2022.
- The average sale price for a townhouse was $635,197. This represents a 9.0 per cent decrease from October 2021 and a decrease of 0.4 per cent compared to September 2022.
- The average sale price for an apartment-style condominium was $488,277. This represents an increase of 3.9 per cent from October 2021 and an increase of 7.3 per cent compared to September 2022.
- The average sale price for a semi was $624,999. This represents a decrease of 10.8 per cent compared to October 2021 and a decrease of 1.9 per cent compared to September 2022.

| MLS® Home Price Index Benchmark Price | ||||||
| Kitchener-Waterloo | Cambridge | |||||
| Benchmark Type: | October 2022 | Monthly % Change | Yr./Yr. % Change | October 2022 | Monthly % Change | Yr./Yr. % Change |
| Composite | $723,200 | -0.2 | -8.8 | $730,700 | -2.3 | -9.8 |
| Detached | $807,900 | -0.0 | -10.1 | $751,800 | -2.1 | -11.6 |
| Townhouse | $603,700 | -1.3 | -3.2 | $663,100 | -2.4 | 1.8 |
| Apartment | $494,400 | -0.1 | 6.5 | $520,100 | -6.6 | 7.3 |

While there is uncertainty in the minds of consumers about current market conditions, one thing is for certain, Waterloo region’s housing supply remains one of the tightest in the country. Buyers may be on the sidelines for now due to affordability, but the underlying demand for housing remains strong.
There were 827 new listings added last month, a decrease of 3.3 per cent compared to October of last year and a 14.3 per cent decrease compared to the previous ten-year average for October.
The total number of homes available for sale in active status at the end of October was 928, an increase of 134.9 per cent compared to October of last year and 34.9 per cent below the previous ten-year average of 1425 listings for October.
The number of months of inventory is up 160.0 per cent compared to October of last year, but still historically low at 1.3 months. Between 2009 and 2015, October’s average months of inventory was 3.6 months. The number of months of inventory represents how long it would take to sell off current inventories at the current sales rate.
The average number of days to sell in October was 22, compared to 10 days in October 2021. The previous 5-year average is 19 days.
Average Sales Price – Municipality

Average Sales Price – Township

Monthly Sales By Property Type

Monthly Supply of Homes for Sale

Monthly Median Sales Price – By Property Type

Monthly Average Sales Price – By Property Type

If you are thinking of buying or selling this fall, wondering what the neighbor’s place sold for, or have any questions at all, give me a call, text at 519-497-4646 or shoot me an email to kevinbakerrealestate@gmail.com
Enjoy the great weather while its here!
Kevin
Home Sales Decline but Prices Hold Steady in Kitchener Waterloo and Cambridge
Happy Thanksgiving! I hope you and your family are able to spend a wonderful holiday together. The weather looks great for the rest of weekend and with the leaves starting to turn fall is certainly here.
The stats are out for September and sales were down considerably over last year and the 5 year average, but prices are starting to hold these levels and have been relatively flat the last 2 months.
There were 518 residential homes were sold last month, a decrease of 25.3 per cent compared to September 2021 and 30.8 per cent below the previous 5-year average for the month.
Total residential sales in September included 313 detached (down 18.9 per cent from September 2021), and 94 townhouses (down 39.0 per cent). Sales also included 60 condominium units (down 37.5 per cent) and 51 semi-detached homes (down 8.9 per cent).
Interest rate hikes have continued to put pressure on the housing market as a whole. The property type that saw the biggest decline in sales was the townhouse segment followed closely by condos, which could indicate there are fewer entry-level buyers in the market due to the higher borrowing costs.
In September, the average sale price for all residential properties in Waterloo Region was $752,421. This represents a 4.7 per cent decrease compared to September 2021 and a 0.1 per cent increase compared to August 2022.
- The average price of a detached home was $862,435. This represents a 7.4 per cent decrease from September 2021 and an increase of 1.3 per cent compared to August 2022.
- The average sale price for a townhouse was $638,284. This represents a 2.7 per cent decrease from September 2021 and an increase of 4.4 per cent compared to August 2022.
- The average sale price for an apartment-style condominium was $455,262. This represents a decrease of 8.5 per cent from September 2021 and a decrease of 2.3 per cent compared to August 2022.
- The average sale price for a semi was $637,205. This represents a decrease of 6.5 per cent compared to September 2021 and a decrease of 2.8 per cent compared to August 2022.

| MLS® Home Price Index Benchmark Price | ||||||
| Kitchener-Waterloo | Cambridge | |||||
| Benchmark Type: | September 2022 | Monthly % Change | Yr./Yr. % Change | September 2022 | Monthly % Change | Yr./Yr. % Change |
| Composite | $724,600 | -1.3 | -6.7 | $748,000 | -0.4 | -3.7 |
| Detached | $807,700 | -0.9 | -8.4 | $768,100 | 0.4 | -5.3 |
| Townhouse | $611,600 | -1.1 | 1.8 | $679,300 | -5.0 | 5.8 |
| Apartment | $493,800 | -3.9 | 9.7 | $556,600 | -3.8 | 16.5 |

While sales were down last month, we seem to be moving towards a more balanced market; buyers now have more inventory to choose from, yet sellers can still expect their properties to sell within a reasonable timeframe. We’re also observing that sale prices are shifting closer to the asking price. Furthermore, the sales-to-new listings ratio of 56.4 per cent in September compared to 70.8 per cent in August. (According to CMHC, a sales-to-new-listings ratio above 55 per cent is associated with a sellers’ market, while an overheating market corresponds to the upper range of a sellers’ market, with a ratio exceeding 70 per cent).
There were 918 new listings added last month, a decrease of 3.6 per cent compared to September of last year and a 15.9 per cent decrease compared to the previous ten-year average for September.
The total number of homes available for sale in active status at the end of September was 978, an increase of 108.5 per cent compared to September of last year and 35.4 per cent below the previous ten-year average of 1515 listings for September.
The number of months of inventory is up 180.0 per cent compared to September of last year, but still historically low at 1.4 months. Between 2009 and 2015, the average number of months of inventory for September was 3.7 months. The number of months of inventory represents how long it would take to sell off current inventories at the current sales rate.
The average number of days to sell in September was 23, compared to 10 days in September 2021. The previous 5-year average is 20 days. Average Sales Price – Municipalit

Average Sales Price – Township

Monthly Sales By Property Type

Monthly Supply of Homes for Sale

Monthly Median Sales Price – By Property Type

Monthly Average Sales Price – By Property Type

Monthly Average Days on Market

If you are thinking of buying or selling this fall, wondering what the neighbor’s place sold for, or have any questions at all, give me a call, text at 519-497-4646 or shoot me an email to kevinbakerrealestate@gmail.com
Enjoy the fall colors and have a wonderful Thanksgiving with your family.
Kevin
Rising Rates Continues To Put Pressure On Home Prices in Kitchener Waterloo and Cambridge
I hope you and your family are doing well and enjoying the beautiful summer weather we are having. With the kids going back to school they must be so excited to reunite with friends again now that covid restrictions are easing and things seem to be back to normal.
Given that school is now back in session, buyers focus will again turn to the real estate market. Rates are continuing to rise so hopefully we will see the market bottom soon and hold steady. Please keep in mind the stats are now including cambridge board as well with the amalgamation of Kitchener Waterloo and Cambridge. Lets take a look….
There were 659 residential homes were sold in August, a decrease of 8.1 per cent compared to August 2021 and 11.2 per cent below the previous 5-year average for the month.
Total residential sales in August included 413 detached (down 0.7 per cent from August 2021), and 117 townhouses (down 24.0 per cent). Sales also included 68 condominium units (down 26.1 per cent) and 61 semi-detached homes (up 10.9 per cent).
While the number of homes sold in August was down on a year-over-year basis they were up almost 19 per cent compared to July. The decline was most pronounced in the apartment-style condo and townhouse categories which could indicate that rising borrowing costs are having a greater impact on first-time buyers and those looking for more affordable options.
In August, the average sale price for all residential properties in Waterloo Region was $750,849. This represents a 0.4 per cent decrease compared to August 2021 and a 0.2 per cent decrease compared to July 2022.
- The average price of a detached home was $851,654. This represents a 3.0 per cent decrease from August 2021 and an increase of 1.1 per cent compared to July 2022.
- The average sale price for a townhouse was $610,725. This represents a 4.2 per cent decrease from August 2021 and a decrease of 5.2 per cent compared to July 2022.
- The average sale price for an apartment-style condominium was $464,959. This represents an increase of 4.3 per cent from August 2021 and a decrease of 10.9 per cent compared to July 2022.
- The average sale price for a semi was $655,813. This represents a decrease of 1.0 per cent compared to August 2021 and a decrease of 0.8 per cent compared to July 2022.

WRAR cautions that average sale price information can be useful in establishing long-term trends but should not be used as an indicator that specific properties have increased or decreased in value. The MLS® Home Price Index (HPI) provides the best way to gauge price trends because averages are strongly distorted by changes in the mix of sales activity from one month to the next.
| MLS® Home Price Index Benchmark Price | ||||||
| Kitchener-Waterloo | Cambridge | |||||
| Benchmark Type: | August 2022 | Monthly % Change | Yr./Yr. % Change | August 2022 | Monthly % Change | Yr./Yr. % Change |
| Composite | $734,500 | -1.9 | -2.2 | $750,700 | -3.4 | 0.6 |
| Detached | $815,000 | -1.5 | -3.9 | $764,700 | -3.1 | -1.3 |
| Townhouse | $618,400 | -3.8 | 5.4 | $715,200 | -5.9 | 11.7 |
| Apartment | $513,600 | -2.1 | 16.1 | $578,500 | -1.1 | 19.0 |

The announcement by the Bank of Canada to increase its policy rate by 75 basis points to 3.25 per cent is discouraging news for borrowers as it affects their purchasing power, however, we see signs that the market is moving towards more buyer-friendly conditions. There are fewer multiple offers resulting in final sale prices being closer to the asking price or with more conditions accompanying offers. Even so, with inventory still very tight.
There were 933 new listings added last month, an increase of 19.3 per cent compared to August of last year, and a 1.2 per cent increase compared to the previous ten-year average for August.
The total number of homes available for sale in active status at the end of August was 1,003, an increase of 188.2 per cent compared to August of last year, and 31.8 per cent below the previous ten-year average of 1593 listings for August.
The number of months of inventory is up 250 per cent compared to August of last year, but still historically low. There were 1.4 months of inventory in August 2022, down from 1.8 months in July 2022. The number of months of inventory represents how long it would take to sell off current inventories at the current sales rate.
The average number of days to sell in August was 22, compared to 12 days in August 2021. The previous 5-year average is 22 days.
Average Sales Price – Municipality

Average Sales Price – Township

Monthly Sales By Property Type

Monthly Supply of Homes for Sale

Monthly Median Sales Price – By Property Type

Monthly Average Sales Price – By Property Type

Monthly Average Days on Market

If you are thinking of buying or selling this fall, wondering what the neighbor’s place sold for, or have any questions at all, give me a call, text at 519-497-4646 or shoot me an email to kevinbakerrealestate@gmail.com
Enjoy the nice weather and have a great September!
Kevin
July Home Prices and Sales Continue to Dip in Kitchener Waterloo and Cambridge
I hope you and your family are doing well and enjoying the beautiful August weather we are having. Hopefully if you are in town you have also been able to enjoy some wonderful free music at the Kitchener Blues Festival going on all weekend!
The Stats are out for July and things are still trending up on available homes for sale and trending down on average prices throughout the region. The stress of increasing mortgage rates are putting more pressure on the consumers ability to purchase a home which keeps prices from finding a bottom at this point.
There were 550 residential homes were sold in July, a decrease of 32.8 per cent compared to July 2021, and 32.3 per cent below the previous 5-year average for the month. We’re seeing a clear shift in the market and what people can afford to purchase or are willing to pay. On the bright side for buyers, it’s not the extreme sellers’ market it was.
Total residential sales in July included 337 detached (down 30.4 per cent from July 2021), and 112 townhouses (down 32.9 per cent). Sales also included 65 condominium units (down 39.3 per cent) and 36 semi-detached homes (down 41.0 per cent).
In July, the average sale price for all residential properties in Waterloo Region was $752,301. This represents a 1.2 per cent decrease compared to July 2021 and a 4.9 per cent decrease compared to June 2022.
- The average price of a detached home was $842,241. This represents a 6.0 per cent decrease from July 2021 and a decrease of 7.0 per cent compared to June 2022.
- The average sale price for a townhouse was $642,750. This represents a 3.6 per cent increase from July 2021 and a decrease of 3.3 per cent compared to June 2022.
- The average sale price for an apartment-style condominium was $521,731. This represents an increase of 20.4 per cent from July 2021 and an increase of 4.1 per cent compared to June 2022.
- The average sale price for a semi was $661,087. This represents an increase of 1.0 per cent compared to July 2021 and a decrease of 5.4 per cent compared to June 2022.

| MLS® Home Price Index Benchmark Price | ||||||
| Kitchener-Waterloo | Cambridge | |||||
| Benchmark Type: | July 2022 | Monthly % Change | Yr./Yr. % Change | July 2022 | Monthly % Change | Yr./Yr. % Change |
| Composite | $749,000 | -5.3 | 1.1 | $776,900 | -3.9 | 3.4 |
| Detached | $827,100 | -5.6 | -0.8 | $789,600 | -4.2 | 1.3 |
| Townhouse | $642,500 | -5.1 | 10.5 | $760,500 | -2.6 | 17.7 |
| Apartment | $524,800 | -2.3 | 17.4 | $584,700 | -0.0 | 20.1 |

The real estate market is cooling across the province, and we are seeing significantly fewer buyers from the GTA, which is also impacting prices, however, this is not entirely bad news since the previous market was not sustainable. The surprising thing is we are seeing rents continue to rise. The demad for rental properties has increased which is putting pressure there as well.
There were 1,174 new listings added last month, an increase of 34.0 per cent compared to July of last year, and a 9.2 per cent increase compared to the previous ten-year average for July.
The total number of homes available for sale in active status at the end of July was 1,283, an increase of 215.2 per cent compared to July of last year, and 19.5 per cent below the previous ten-year average of 1593 listings for July.
The number of months of inventory was 1.7 months in July, as it was in June. While this is still at historic lows, the last time it was near this range was September of 2019 when it was 1.6 months. The number of months of inventory represents how long it would take to sell off current inventories at the current sales rate.
The average number of days to sell in July was 18, compared to 11 days in July 2021. The previous 5-year average is 17 days.
Average Sales Price – Municipality

Average Sales Price – Township

Monthly Sales By Property Type

Monthly Supply of Homes for Sale

Monthly Median Sales Price – By Property Type

Monthly Average Sales Price – By Property Type

Monthly Average Days on Market

If you are thinking of buying or selling this summer and fall, wondering what the neighbor’s place sold for, or have any questions at all, give me a call, text at 519-497-4646 or shoot me an email to kevinbakerrealestate@gmail.com
Enjoy the nice weather and have a great rest of the summer!
Kevin
Home Prices Dip In June Here In Kitchener Waterloo
I hope you and your family are doing well and enjoyed your long holiday weekend. Summer is here so make sure you get out and enjoy the nice weather and hopefully some vacation time with the family.
The June stats are out and things are still cooling off in the housing market here in Waterloo region as expected with the threat of higher interest rates and a possible recession.
There were 561 residential homes sold in June, a decrease of 24.0 per cent compared to the same month last year, and 17.3 per cent below the previous 5-year average.
For the fourth consecutive month we’re seeing home prices moderate as the number of properties available for sale has steadily increased. In June the average price of a detached home has levelled off to where it was this time last year.
Total residential sales in June included 326 detached (down 20.7 per cent from June 2021), and 103 townhouses (down 32.2 per cent). Sales also included 84 condominium units (down 18.4 per cent) and 48 semi-detached homes (down 33.3 per cent).
In June, the average sale price for all residential properties in the Kitchener-Waterloo area was $791,674. This represents a 4.2 per cent increase over June 2021 and a 9.6 per cent decrease compared to May 2022.
- The average price of a detached home was $920,349. This represents a 0.0 per cent change from June 2021 and a decrease 9.5 per cent compared to May 2022.

The MLS® HPI composite benchmark price for all residential properties in Kitchener-Waterloo was $790,600 in June. This represents a 6.8 per cent increase over June 2021 and a 6.8 per cent decrease compared to May 2022.
- The benchmark price for a detached home was $876,600. This represents a 5.3 per cent increase from June 2021 and 7.3 per cent decrease compared to May 2022.

This time last year, sales were going through the roof, but the home buying scene is a little different this year with the recent mortgage rate hikes both long and short term as well as the possibility of a recession hitting the global economy.
While any shift in the market will result in some individuals predicting the worse, the simple reality is that the market we had been in was unsustainable. What this means for buyers is more inventory, more choices, and perhaps most importantly, potentially less stress when purchasing. For sellers, they need to ensure their properties stand out from the competition and be aware it may take more time to sell their home and for potentially less money than they were expecting.
There were 1,285 new listings added last month, an increase of 49.2 per cent compared to June of last year, and a 41.7 per cent increase compared to the previous ten-year average for June.
The total number of homes available for sale in active status at the end of June was 991, an increase of 165.0 per cent compared to June of last year, and 20.6 per cent below the previous ten-year average of 1249 listings for June.
The number of months of inventory increased to 1.8 months in June from 1.6 months in May. While inventory is still at historic lows, this is the highest it’s been since September 2019 and a return to where inventory was in the pre-pandemic June of 2019. The number of months of inventory represents how long it would take to sell off current inventories at the current rate of sales.
The average number of days to sell in June was 13 days, compared to 11 days in June 2021. The previous 5-year average is 17 days. Keep in mind though this number is skewed in my opinion due to home listings being cancelled and relisted after a week or two.
Historical Sales By Property Type

Months Supply of Homes for Sale

Historical Median Sales Price – By Property Type

Historical Average Sales Price – By Property Type


If you are thinking of buying or selling this summer, wondering what the neighbor’s place sold for, or have any questions at all, give me a call, text at 519-497-4646 or shoot me an email to kevinbakerrealestate@gmail.com
Enjoy the nice weather and have a great July!
Kevin
May home sales slow and inventory increases in Waterloo Region
I hope you and your family are doing well. Summer is here so make sure you get out and enjoy the nice weather. I for one am looking forward to some well deserved vacation time out of my house 🙂
May stats are out and the market continues to be a little slower than what we have been used to over the past 3-4 years. There were 661 residential homes sold in May, a decrease of 22.7 per cent compared to the same month last year, and 5.5 per cent below the previous 5-year average.
The increase by the Bank of Canada to the key interest rate in April had the predictable result of knocking some buyers down if not out of the market in May unfortunatley. While the impact to prices is small, it has had a critical impact on some buyers and what they can now afford.
Total residential sales in May included 404 detached (down 16.7 per cent from May 2021), and 115 townhouses (down 38.5 per cent). Sales also included 95 condominium units (down 12.0 per cent) and 47 semi-detached homes (down 36.5 per cent).
In May, the average sale price for all residential properties in the Kitchener-Waterloo area was $875,194. This represents a 18.3 per cent increase over May 2021 and a 3.5 per cent decrease compared to April 2022.
- The average price of a detached home was $1,016,834. This represents a 17.0 per cent increase from May 2021 and a decrease 4.2 per cent compared to April 2022.
- The average sale price for a townhouse was $708,722. This represents a 17.7 per cent increase from May 2021 and a decrease of 7.2 per cent compared to April 2022.
- The average sale price for an apartment-style condominium was $545,825. This represents an increase of 19.7 per cent from May 2021 and a decrease of 9.1 per cent compared to April 2022.
- The average sale price for a semi was $730,768. This represents an increase of 10.7 per cent compared to May 2021 and a decrease of 7.0 per cent compared to April 2022.

KWAR cautions that average sale price information can be useful in establishing long-term trends but should not be used as an indicator that specific properties have increased or decreased in value. The MLS® Home Price Index (HPI) provides the best way to gauge price trends because averages are strongly distorted by changes in the mix of sales activity from one month to the next.
The MLS® HPI composite benchmark price for all residential properties in Kitchener-Waterloo was $848,600 in May. This represents a 15.1 per cent increase over May 2021 and a 4.7 per cent decrease compared to April 2022.
- The benchmark price for a detached home was $945,800. This represents a 14.6 per cent increase from May 2021 and 4.9 per cent decrease compared to April 2022.
- The benchmark price for a townhouse is $728,300. This represents a 22.6 per cent increase from May 2021 and a 5.1 per cent decrease compared to April 2022.
- The benchmark price for an apartment-style condominium was $550,100. This represents a 26.9 per cent increase from May 2021 and a 1.8 per cent decrease compared to April 2022.

With the announcement from the Bank of Canada about another interest rate hike this week we may see a resurgence of buyers who have locked in at a lesser rate, but as borrowing costs continue to increase, we should expect demand will continue to soften, particularly in the more entry-level segment of the market.
There were 1,422 new listings in KW and area last month, an increase of 33.9 per cent compared to May of last year, and a 40.4 per cent increase compared to the previous ten-year average for May.
The total number of homes available for sale in active status at the end of May was 902, an increase of 98.2 per cent compared to May of last year, and 28.8 per cent below the previous ten-year average of 1267 listings for May.
The number of months of inventory increased to 1.6 months in May from 1.2 months in April. While inventory is still at historic lows, this is the highest it’s been since September 2019. The number of months of inventory represents how long it would take to sell off current inventories at the current rate of sales.
The average number of days to sell in May was 11 days, compared to 9 days in May 2021. The previous 5-year average is 16 days. This number can show as a bit skewed though as many homes are listing, not receiving offers and then cancelled and reslisted a few weeks later showing up as a new listing and keeping the days on market lower than what truely is happening.
I think what you have to remember is that even though the market is starting to pull back and its taking a little longer to sell homes, we are still in a historically great market for buying and selling. Don’t let all the negative news hype out there affect your bias on things.
Historical Sales By Property Type

Months Supply of Homes for Sale

Historical Median Sales Price – By Property Type

Historical Average Sales Price – By Property Type


If you are thinking of buying or selling this summer, wondering what the neighbor’s place sold for, or have any questions at all, give me a call, text at 519-497-4646 or shoot me an email to kevinbakerrealestate@gmail.com
Enjoy the nicer weather and have a great June!
Kevin
Home sales slow and Inventory Increases in Kitchener Waterloo
I hope you and your family are doing well and you had a nice Easter. Looks like the spring weather if finally here as well which is great news for Mothers day weekend!
The market stats are out for April and the market is still showing signs of a slight pull back compared to what we seen earlier in the year. Last month introduced a small measure of relief especially for buyers and we’re seeing fewer multiple offers and more conditions on offers making their way back into the market
There were 633 residential homes sold in April 2022 which is a decrease of 25.0 per cent compared to April 2021. On a month-over-month basis, sales in April were down 13.4 per cent compared to March 2022. The previous ten-year average number of residential sales for April is 608 (650 if not including April 2020 when home sales came to a short-term pause due to the beginning of the Covid-19 pandemic).
Total residential sales in April included 361 (down 25.4 per cent from April 2021), and 107 condominium units (down 2.7 per cent). Sales also included 48 semi-detached homes (down 29.4 per cent) and 117 townhouses (down 35.7 per cent).
In April, the average sale price for all residential properties in the Kitchener-Waterloo area was $907,205. This represents a 19.6 per cent increase over April 2021 and a 5.5 per cent decrease compared to March 2022.
- The average price of a detached home was $1,060,992. This represents a 18.0 per cent increase from April 2021 and a decrease 6.4 per cent compared to March 2022.

The MLS® HPI composite benchmark price for all residential properties in Kitchener-Waterloo was $929,300 in April. This represents a 24.5 per cent increase over April 2021 and a 3.2 per cent decrease compared to March 2022.
- The benchmark price for a detached home was $998,400. This represents a 23.4 per cent increase from April 2021 and 4.6 per cent decrease compared to March 2022.

The trajectory the market was on was simply not sustainable, however, I want to emphasize it would be premature to draw any conclusions on just a single month’s activity. The housing market in Waterloo Region is still very much a sellers’ market, but sellers may need to adjust their expectations. We noticed this shift after the Bank of Canada’s recent rate increase reinforcing that it has been cheap money empowering too many buyers to chase after too few listings driving the market rather than anything else.
There were 1,277 new listings added to the MLS® System in KW and area last month, an increase of 16.2 per cent compared to April of last year, and a 40.2 per cent increase compared to the previous ten-year average for April.
The total number of homes available for sale in active status at the end of April was 703, an increase of 48.6 per cent compared to April of last year, and 39.9 per cent below the previous ten-year average of 1,169 listings for April. This is the first time since September 2019 that the total number of homes for sale metric has been over 700.
The number of months of inventory increased to 1.2 months in April from 0.7 months in March. This is the first time since September 2020 that inventory has nudged above the one-month mark. The number of months of inventory represents how long it would take to sell off current inventories at the current rate of sales.
The average number of days to sell in April was 9 days, the same as it was in April 2021. The previous 5-year average is 16 days.
Historical Sales By Property Type

Months Supply of Homes for Sale

Historical Median Sales Price – By Property Type

Historical Average Sales Price – By Property Type


If you are thinking of buying or selling this spring, wondering what the neighbor’s place sold for, or have any questions at all, give me a call, text at 519-497-4646 or shoot me an email to kevinbakerrealestate@gmail.com
Enjoy the nicer weather and Happy Mothers Day to all the Mom’s out there!
Kevin
March Homes Sales up but Prices Dip in Waterloo Region
I hope you and your family are doing well. Looks like spring is here and Easter is just around the corner. The March stats are out and home sales are up over February, but prices have taken a small dip from the february average as well. Lets take a look at the numbers…
There were 725 residential homes sold in March 2022 is a decrease of 27.1 per cent compared to March 2021, which continues to hold the record for most home sales in a single month. On a month-over-month basis, sales in March were up 19.4 per cent compared to February 2022. The previous ten-year average number of residential sales for March is 599.
The skyrocketing prices of the last two months took a bit of a breather in March, with the overall average price dipping five per cent compared to what we saw in February. While it is too soon to draw conclusions from just one month of home sales, I know many will be comforted to see a leveling off on the average price, no matter how incremental.
Total residential sales in March included 416 detached (down 29.7 per cent from March 2021), and 114 condominium units (down 9.5 per cent). Sales also included 64 semi-detached homes (down 17.9 per cent) and 131 townhouses (down 33.8 per cent).
In March, the average sale price for all residential properties in the Kitchener-Waterloo area was $960,181. This represents a 25.5 per cent increase over March 2021 and a 4.6 per cent decrease compared to February 2022.
- The average price of a detached home was $1,132,637. This represents a 25.9 per cent increase from March 2021 and a decrease 6.4 per cent compared to February 2022.

The MLS® HPI composite benchmark price for all residential properties in Kitchener-Waterloo was $960,100 in March. This represents a 29.6 per cent increase over March 2021 and a 1.5 per cent decrease compared to February 2022.
- The benchmark price for a detached home was $1,046,200. This represents a 28.1 per cent increase from March 2021 and 4.0 per cent decrease compared to February 2022.

Even though the average price decreased across all property types on a month-to-month basis, the MLS® HPI showed continued monthly gains for both townhouse and apartment property types. As the province feels its way out of the pandemic, we are beginning to see some very preliminary signs of a potential cooling. We are not seeing quite as many multiple offers and some offers are coming in with conditions. Of course, when we say cooling, we’re talking about a market that has been scorching hot which is why we are pleased to see this happening.
There were 1,131 new listings added last month, a decrease 16.8 per cent compared to the record topping number of listings added in March of last year, and a 28.0 per cent increase compared to the previous ten-year average for March.
The total number of homes available for sale in active status at the end of March was 441, an increase of 1.1 per cent compared to March of last year, and 59.0 per cent below the previous ten-year average of 1,072 listings for March.
The number of months of inventory nudged up to 0.7 months in March from 0.5 months in February. Inventory has been under the one-month mark since October 2020. The number of months of inventory represents how long it would take to sell off current inventories at the current rate of sales.
The average number of days to sell in March was 8 days, the same as it was in March 2021. The previous 5-year average is 16 days.
Historical Sales By Property Type

Months Supply of Homes for Sale

Historical Median Sales Price – By Property Type

Historical Average Sales Price – By Property Type


If you are thinking of buying or selling this spring, wondering what the neighbor’s place sold for, or have any questions at all, give me a call, text at 519-497-4646 or shoot me an email to kevinbakerrealestate@gmail.com
Enjoy the nicer weather and have a wonderful Easter with your family!
Kevin
Sales Up, Inventory Up and Prices Up in Kitchener Waterloo
I hope you and your family are doing well. Looks like this weekend we will have some nice weather in Waterloo Region so hopefully spring is around the corner. The February stats are out and the market is still moving higher. Lets take a look at the numbers…
The 600 residential homes sold last month is almost on par with February 2021, and an increase of 48.5 per cent compared to the previous month. The previous ten-year average number of residential sales for February is 424.
In January we reported that the average price of a detached home crossed the million-dollar mark for the first time in December. Now in February, we have reached a new milestone with the average sale price of all residential property types coming in at just over one million dollars in the Kitchener-Waterloo and area. While I think it’s premature to suggest this is the new norm, it does reflect the continued appeal of Waterloo Region to buyers. We also need to be aware and recognize the impact this has on affordability for a growing number of people.
Total residential sales in February included 331 detached (down 2.1 per cent from February 2021), and 110 condominium units (up 7.8 per cent). Sales also included 44 semi-detached homes (down 4.3 per cent) and 115 townhouses (up 2.7 per cent).
In February, the average sale price for all residential properties in the Kitchener-Waterloo area was $1,007,109. This represents a 33.6 per cent increase over February 2021 and a 5.6 per cent increase compared to January 2022.
- The average price of a detached home was $1,214,067. This represents a 33.1 per cent increase from February 2021 and an increase of 5.3 per cent compared to January 2022.
- The average sale price for an apartment-style condominium was $572,731. This represents an increase of 37.4 per cent from February 2021 and an increase of 6.9 per cent compared to January 2022.
- The average sale price for a townhouse was $862,994. This represents a 41.6 per cent increase from February 2021 and an increase of 2.1 per cent compared to January 2022.
- The average sale price for a semi was $917,535. This represents an increase of 33.8 per cent compared to February 2021 and an increase of 8.0 per cent compared to January 2022.

The MLS® HPI composite benchmark price for all residential properties in Kitchener-Waterloo was $974,600 in February. This represents a 36.8 per cent increase over February 2021 and a 5.4 per cent increase compared to January 2022.
- The benchmark price for a detached home was $1,090,000. This represents a 38.2 per cent increase from February 2021 and 5.0 per cent increase compared to January 2022.
- The benchmark price for an apartment-style condominium was $ 464,400. This represents a 33.8 per cent increase from February 2021 and a 6.1 per cent increase compared to January 2022.
- The benchmark price for a townhouse is $729,900. This represents a 41.9 per cent increase from February 2021 and a 7.0 per cent increase compared to January 2022.

The low listing inventory is not because people are not selling their homes, in fact we saw a spurt in the number of new listings in February, but with homebuying demand still going strong, competition remains high, and homes were snapped up quickly.
There were 806 new listings added to the MLS® System in KW and area last month, an increase of 9.5 per cent compared to February of last year, and a 24.3 per cent increase compared to the previous ten-year average for February.
The total number of homes available for sale in active status at the end of February was 290, a decrease of 2.7 per cent compared to February of last year, and 70.3 per cent below the previous ten-year average of 975 listings for February.
The number of months of inventory nudged up to 0.5 months in February from 0.3 months in January. Inventory has been under the one-month mark since October 2020. The number of months of inventory represents how long it would take to sell off current inventories at the current rate of sales.
The average number of days to sell in February was 8 days, compared to 10 days in February 2021 and a previous 5-year average of 19 days.
Historical Sales By Property Type

Months Supply of Homes for Sale

Historical Median Sales Price – By Property Type

Historical Average Sales Price – By Property Type


If you are thinking of buying or selling this spring, wondering what the neighbor’s place sold for, or have any questions at all, give me a call, text at 519-497-4646 or shoot me an email to kevinbakerrealestate@gmail.com
Enjoy the nice weather this weekend and have a great March!
Kevin
Waterloo Region’s 2021 Real Estate Year in Review
Happy New Year! I truely hope that you and your family enjoyed a wondeful holiday season and 2022 brings you a renewed sense of normal that we are all certainly looking forward too after the last couple of years.
2021 was another crazy year for Real Estate here in Waterloo Region. We blew away records in sales volume and the average price for a single detached home surpassed the 1 million dollar mark for the first time ever.
Lets look at all the numbers…
The 7,581 residential homes sold in 2021 represent an increase of 18.3 per cent compared to last year’s record-setting number of sales that ended the year 2020.
On a monthly basis, there were 344 residential homes sold last month, a decrease of 1.7 percent compared to the same month last year.
Home sales in 2021 have absolutely smashed last year’s record by more than 1,000 units. While this is a good time to sell your home, it remains a tremendously difficult market for buyers. Affordability for all types of housing within our community continues to be a concern which we expect to continue throughout 2022.
Total residential sales in December included 177 detached (down 12.4 percent from December 2020), and 56 condominium units (down 11.1 percent). Sales also included 23 semi-detached homes (up 9.5 percent) and 88 townhouses (up 37.5 percent).
For 2021 total residential sales included 4,272 detached (up 10.8 percent), and 1,127 condominium units (up 43.4 percent). Sales also included 578 semi-detached homes ( up 31.1 percent) and 1,602 townhouses ( up 20.9 percent).
In December, the average sale price for all residential properties in the Kitchener-Waterloo area was $842,014. This represents a 32.5 per cent increase over December 2020 and a 2.5 per cent increase compared to November 2021.
- The average price of a detached home was $1,021,353. This represents a 34.7 per cent increase from December 2020 and an increase of 3.4 percent compared to November 2021.
- The average sale price for an apartment-style condominium was $500,352. This represents an increase of 30.6 percent from December 2020 and an increase of 1.0 percent compared to November 2021.
- The average sale price for a townhouse was $717,475. This represents a 39.4 per cent increase from December 2020 and an increase of 2.1 percent compared to November 2021.
- The average sale price for a semi was $770,246. This represents an increase of 33.5 percent compared to December 2020 and an increase 7.3 percent compared to November 2021.
On a year-to-date basis, the average sale price for all residential properties in the Kitchener-Waterloo area increased 25.8 per cent to $770,596 compared to 2020.
- The year-to-date average price of a detached home was $920,726. This represents a 28.0 percent increase compared to 2020.
- The year-to-date average sale price for an apartment-style condominium was $448,208. This represents an increase of 17.3 compared to 2020
- The year-to-date average sale price for a townhouse was $632,875. This represents an increase of 34.9 percent compared to 2020.
- The year-to-date average sale price for a semi was $673,543. This represents an increase of 29.4 percent compared to 2020.

KWAR cautions that average sale price information can be useful in establishing long-term trends but should not be used as an indicator that specific properties have increased or decreased in value. The MLS® Home Price Index (HPI) provides the best way to gauge price trends because averages are strongly distorted by changes in the mix of sales activity from one month to the next.
The MLS® HPI composite benchmark price for all residential properties in Kitchener-Waterloo was $851,700 in December. This represents a 32.1 per cent increase over December 2020 and a 3.2 per cent increase compared to November 2021.
- The benchmark price for a detached home was $945,600. This represents a 33.5 per cent increase from December 2020 and 3.3 percent increase compared to November 2021.
- The benchmark price for an apartment-style condominium was $412,700. This represents a 21.1 percent increase from December 2020 and a 3.7 percent increase compared to November 2021.
- The benchmark price for a townhouse is $647,000. This represents a 40.0 percent increase from December 2020 and a 3.0 per cent increase compared to November 2021.
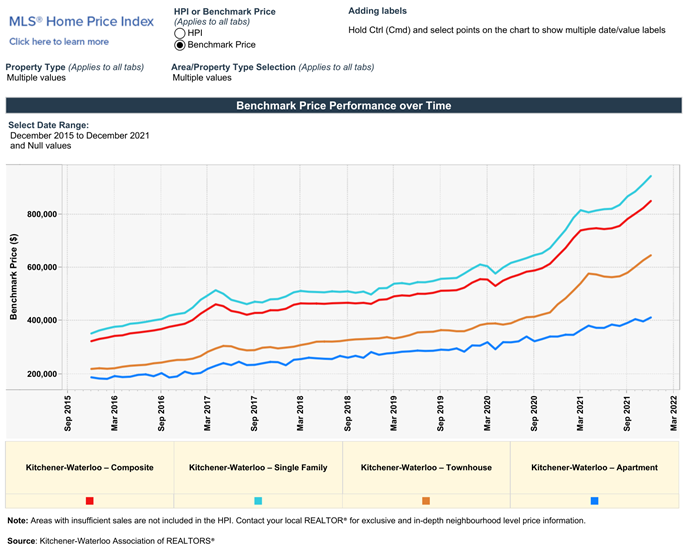
There were 291 new listings added in KW and area last month, an increase of 1.7 percent compared to December of last year, and a 14.6 percent increase compared to the previous ten-year average for December.
On a year-to-date basis, there were 9,040 new listings added in KW and area in 2021, an increase of 11.5 percent compared to 2020, and a 3.8 percent increase compared to the previous ten-year annual average.
The total number of homes available for sale in active status at the end of December was 104, a decrease of 45.3 percent compared to December of last year, and 85.7 percent below the previous ten-year average of 727 listings for December.
The number of months of inventory touched an all-time low of 0.2 in December. Inventory has settled at under 1 month for fourteen consecutive months. The number of months of inventory represents how long it would take to sell off current inventories at the current rate of sales.
Supply not keeping up with demand was the new normal in 2021, and unfortunately I expect that will continue to be the case in the year ahead. We need all levels of government working together to bring more supply into the housing market.
The average number of days to sell in December stayed at 10 days, compared to 16 days in December 2020 and a previous 5-year average of 28 days.
The average days to sell in 2021 was 10 days, compared to 16 days in 2020 and a previous 5-year average of 22 days.
If you are thinking of buying or selling in the coming months, wonder what the neighbor sold for, or have any questions at all, give me a call, text at 519-497-4646 or shoot me an email to kevinbaker@kwhometeam.ca.
Have a wonderful January and enjoy all the winter activities the region has to offer.
Kevin
HOME SALES CONTINUE TO HUM ALONG IN JULY IN KITCHENER WATERLOO
Hope you and your family are enjoing your summer. The weather this weekend has been beautiful so i hope you have been able to get out and enjoy it.
The Real estate market here in Waterloo region continues to show incredible strength with low invetory and strong demand which is keeping prices humming in July.
The was a total of 611 residential homes sold last month, a decrease of 17 per cent compared to the record-setting results of July 2020, but still an above-average number of sales for the month of July.
Total residential sales in July included 339 detached (down 27.1 per cent from July 2020), and 91 condominium units (up 30 per cent). Sales also included 46 semi-detached homes (down 4.2) and 135 townhouses (down 11.8 per cent).
In July, the average sale price for all residential properties in the Kitchener-Waterloo area was $755,681. This represents a 18.2 per cent increase over July 2020 and a 0.6 per cent decrease compared to June 2021.
- The average price of a detached home was $907,192. This represents a 21.9 per cent increase from July 2020 and a decrease of 1.4 per cent compared to June 2021.
- The average sale price for an apartment-style condominium was $429,630. This represents an increase of 6.7 per cent from July 2020 and a decrease of 3.6 per cent compared to June 2021.
- The average sale price for a townhouse was $623,732. This represents a 33.8 per cent increase from July 2020 and an increase of 5.4 per cent compared to June 2021.
- The average sale price for a semi was $667,570. This represents an increase of 28.6 per cent compared to July 2020 and an increase of 2.9 per cent compared to June 2021.

The MLS® HPI composite benchmark price for all residential properties in Kitchener-Waterloo was $748,700 in July. This represents a 30.5 per cent increase over July 2020 and a 0.4 per cent increase compared to June 2021.
- The benchmark price for a detached home was $822,300. This represents a 31.1 per cent increase from July 2020 and 0.2 per cent increase compared to June 2021.
- The benchmark price for an apartment-style condominium was $385,900. This represents a 19.5 per cent increase from July 2020 and a 3.3 per cent increase compared to June 2021.
- The benchmark price for a townhouse is $564,500. This represents a 40 per cent increase from July 2020 and a 0.4 per cent decrease compared to June 2021.

The housing market took a bit of a breather last month and July is typically a quieter month with families taking vacation, and with the region coming out of lockdown there were certainly more staycations happening. But we do anticipate the market will pick up steam again and it will be another busy fall.
There were 675 new listings added to the MLS® System in KW and area last month, a decrease of 24 per cent compared to July of last year, and a 14.4 per cent decrease compared to the previous ten-year average for July.
The total number of homes available for sale in active status at the end of July was 281, a decrease of 52.7 per cent compared to July of last year, and 79.1 per cent below the previous ten-year average of 1,346 listings for July.
The number of months of inventory was 0.4 in July, a decline from 0.5 months in June. Inventory has numbered less than 1 month since October. The number of months of inventory represents how long it would take to sell off current inventories at the current rate of sales.
The average number of days to sell in July was 11 days, compared to 17 days in July 2020 and a previous 5-year average of 22 days.
Historical Sales By Property Type

Months Supply of Homes for Sale

Historical Median Sales Price – By Property Type

Historical Average Sales Price – By Property Type


If you are thinking of buying or selling in the coming months, wonder what the neighbor sold for, or have any questions at all, give me a call, text at 519-497-4646 or shoot me an email to kevinbaker@kwhometeam.ca.
Have a wonderful rest of the weekend and stay safe!
Kevin
Home Sales Continue to Smash Records
Hope you and your family have been doing well. The weather this weekend has been beautiful so i hope you have been able to get out and enjoy it.
As for the Real estate market it is still going exceptionally strong and we continue to smash records.
Lets look at the stats…
Strong home sales continued in May once again posted a record-setting number of monthly home sales. There were 854 residential homes sold, an increase of 100.9 per cent compared to May 2020, and a 0.9 per cent increase compared to April 2021.
While last May home sales were restrained due to the pandemic, May 2021 was another extraordinary month of home buying and selling activity. Prior to 2020, the previous 10-year average number of residential sales for May was 656.
Total residential sales in May included 485 detached (up 85.8 per cent from May 2020), and 106 condominium units (up 152.4 per cent). Sales also included 74 semi-detached homes (up 72.1 per cent) and 188 townhouses (up 138 per cent).
In May, the average sale price for all residential properties in the Kitchener-Waterloo area was $740,103. This represents a 30.4 per cent increase over May 2020 and a 2.4 per cent decrease compared to April 2021.
- The average price of a detached home was $868,990. This represents a 32.6 per cent increase from May 2020 and a decrease of 3.4 per cent compared to April 2021.
- The average sale price for an apartment-style condominium was $457,935. This represents an increase of 38.6 per cent from May 2020 and an increase of 3.1 per cent compared to April 2021.
- The average sale price for a townhouse was $601,987. This represents a 33.7 per cent increase from May 2020 and a decrease of 1.8 per cent compared to April 2021.
- The average sale price for a semi was $659,975. This represents an increase of 36.8 per cent compared to May 2020 and an increase of 1.2 per cent compared to April 2021.
Last month the market took a breath and calmed a bit, but there is still very strong demand throughout our region. This started prior to the new mortgage stress test that came into effect on June 1. While these changes will impact the affordability for some, I do not expect it to be very impactful due to the sheer number of buyers in our market.
Average Sales Price – By Property Type

The MLS® HPI composite benchmark price for all residential properties in Kitchener-Waterloo was $749,100 in May. This represents a 35.8 per cent increase over May 2020 and a 0.4 per cent increase compared to April 2021.
- The benchmark price for a detached home was $815,800. This represents a 35.8 per cent increase from May 2020 and 0.8 per cent decrease compared to April 2021.
- The benchmark price for an apartment-style condominium was $373,700. This represents a 16.9 per cent increase from May 2020 and a 2.1 per cent decrease compared to April 2021.
- The benchmark price for a townhouse is $574,900. This represents a 49 per cent increase from May 2020 and a 0.5 per cent decrease compared to April 2021.

There were 1,061 new listings added in KW and area last month, an increase of 83.2 per cent compared to May of last year, and a 2.6 per cent increase compared to the previous ten-year average for May* (*calculated from 2010 to 2019 to adjust for the impact of the state of emergency on activity in May 2020).
The total number of homes available for sale in active status at the end of May was 448, a decrease of 20 per cent compared to May of last year, and 70.5 per cent below the previous ten-year average of 1,520 listings for May* (*calculated from 2010 to 2019 to adjust for the impact of the state of emergency on activity in May 2020).
The number of months of inventory was 0.7 in May, which is unchanged from April. Inventory has numbered less than 1 month since October. The number of months of inventory represents how long it would take to sell off current inventories at the current rate of sales.
The average number of days to sell in May was 9 days, compared to 21 days in May 2020 and a previous 5-year average of 20 days.
If you are thinking of buying or selling in the coming months, wonder what the neighbor sold for, or have any questions at all, give me a call, text at 519-497-4646 or shoot me an email to kevinbaker@kwhometeam.ca.
Have a wonderful rest of the weekend and stay safe!
Kevin
Historical Sales By Property Type

Months Supply of Homes for Sale

Historical Median Sales Price – By Property Type

Historical Average Sales Price – By Property Type


April Home Sales 2nd Highest on Record in Kitchener, Waterloo and Cambridge
Hope you and your family have been doing well. How are you surviving the lockdown? Personally this whole covid thing is getting a little old and I wish things could just go back to normal as i am sure you do too.
As for the Real estate market it is still going exceptionally strong and we had the 2nd highest sales on record for April!
Lets look at the stats…
Following last month’s record-smashing number of home sales, we posted the second-highest number of monthly home sales in April. There were 843 residential homes sold, an increase of 263.4 per cent compared to April 2020, and a decrease of 15.5 per cent compared to March 2021.
Even if we do not take into account April 2020, when Ontario was in the early days of its state of emergency, it was still an exceptional number of homes sold last month. The previous 10-year average number of residential sales for April was 618.
Total residential sales in April included 484 detached (up 233.8 per cent from April 2020), and 111 condominium units (up 382.6 per cent). Sales also included 67 semi-detached homes (up 294.1 per cent) and 181 townhouses (up 285.1 per cent).
In April, the average sale price for all residential properties in the Kitchener-Waterloo area was $757,906. This represents a 34.3 per cent increase over April 2020 and a 0.9 per cent decrease compared to March 2021.
- The average price of a detached home was $899,315. This represents a 36.9 per cent increase from April 2020 and an increase of 0.04 per cent compared to March 2021.
- The average sale price for an apartment-style condominium was $441,887. This represents an increase of 21.2 per cent from April 2020 and an increase of 4.2 per cent compared to March 2021.
- The average sale price for a townhouse was $612,550. This represents a 52.1 per cent increase from April 2020 and a decrease of 2.03 per cent compared to March 2021.
- The average sale price for a semi was $652,609. This represents an increase of 33.0 per cent compared to April 2020 and an increase of 0.18 per cent compared to March 2021.
We are starting to see home prices calm down in March and April compared to what was happening in January and February which is great news for buyers.

The MLS® HPI composite benchmark price for all residential properties in Kitchener-Waterloo was $742,800 in April. This represents a 40.4 per cent increase over April 2020 and a 0.6 per cent increase compared to March 2021.
- The benchmark price for a detached home was $809,000. This represents a 39.9 per cent increase from April 2020 and 1.0 per cent decrease compared to March 2021.

There were 1,098 new listings last month, an increase of 162.7 per cent compared to April of last year, and a 17.15 per cent increase compared to the previous ten-year average for April* (*calculated from 2019 to 2010 to adjust for the impact of the state of emergency on activity in April 2020).
The total number of homes available for sale in active status at the end of April was 458, a decrease of 21.8 per cent compared to April of last year, and 66.9 per cent below the previous ten-year average of 1,384 listings for April* (*calculated from 2010 to 2019 to adjust for the impact of the state of emergency on activity in April 2020).
The number of months of inventory was 0.7 in April, which is unchanged from March. Inventory has numbered less than 1 month since October. The number of months of inventory represents how long it would take to sell off current inventories at the current rate of sales.
The average number of days to sell in April was 9 days, compared to 19 days in April 2020 and a previous 5-year average of 21 days.
If you are thinking of buying or selling in the coming months, wonder what the neighbor sold for, or have any questions at all, give me a call, text at 519-497-4646 or shoot me an email to kevinbaker@kwhometeam.ca.
Have a wonderful weekend and stay safe!
Kevin
Historical Sales By Property Type

Months Supply of Homes for Sale

Historical Median Sales Price – By Property Type

Historical Average Sales Price – By Property Type


Record Breaking Home Sales for March in Kitchener Waterloo
Hope you and your family have been doing well and everyone is staying safe. Unfortunatley lockdowns are back for the next 4 weeks so i hope that things will get back to some kind of normal at some point this year.
As for the Real estate market it is still going exceptionally strong and we broke a total sales record in March! Even though everyone is saying there is no inventory that is not the case. There is lots of inventory but the buyers still out number the sellers with all the GTA buyers coming to scoop up properties.
Lets look at the stats from March…
March posted the highest number of monthly home sales in the board’s history. There were 993 residential homes sold, an increase of 72.7 per cent compared to March 2020, and an increase of 66 per cent compared to the previous month. The previous 10-year average number of residential sales for March is 552.
Total residential sales in March included 593 detached (up 69.4 per cent from March 2020), and 124 condominium units (up 82.4 per cent). Sales also included 79 semi-detached homes (up 216 per cent) and 197 townhouses (up 49.2 per cent).
In March, the average sale price for all residential properties in the Kitchener-Waterloo area was $765,393. This represents a 30.8 per cent increase over March 2020, and a 1.5 per cent increase compared to February 2021.
- The average price of a detached home was $899,460. This represents a 32.3 per cent increase from March 2020, and a decrease of 1.4 per cent compared to February 2021.
- The average sale price for an apartment-style condominium was $423,470. This represents an increase of 12 per cent from March 2020, and an increase of 1.6 per cent compared to February 2021.
- The average sale price for a townhouse was $622,258. This represents a 35.9 per cent increase from March 2020, and an increase of 2 per cent compared to February 2021.
- The average sale price for a semi was $652,669. This represents an increase of 32.5 per cent compared to March 2020, and a decrease of 4.8 per cent compared to February 2021.
On a year-over-year basis we continued to see huge price increases in the average price in March, however compared to February we are seeing some signs that perhaps prices may be starting to stabilize a bit.
The MLS® HPI composite benchmark price for all residential properties in Kitchener-Waterloo was $738,200 in March. This represents a 33.4 per cent increase over March 2020 and a 4 per cent increase compared to February 2021.
- The benchmark price for a detached home was $817,000. This represents a 34.4 per cent increase from March 2020 and 3.6 per cent increase compared to February 2021.
- The benchmark price for an apartment-style condominium was $358,700. This represents a 14.9 per cent increase from March 2020 and a 5.1 per cent increase compared to February 2021.
- The benchmark price for a townhouse is $554,900. This represents a 38.3 per cent increase from March 2020 and a 5.4 per cent increase compared to February 2021.
In addition to the record number of sales in March, we also had a record number of newly listed properties come on the market. The number of new listings last month was the most of any month, and the highest number since May of 2017 when there were 1,271 new listings.
There were 1,359 new listings added to the MLS® System in KW and area last month, an increase of 56.2 per cent compared to March of last year, and a 63.9 per cent increase compared to the previous ten-year average for March.
The total number of homes available for sale in active status at the end of March was 434, a decrease of 23.5 per cent compared to March of last year, and 63.5 per cent below the previous ten-year average of 1,188 listings for March.
The number of months of inventory was 0.7 in March and has numbered less than 1 month since October. The number of months of inventory represents how long it would take to sell off current inventories at the current rate of sales.
The average number of days to sell in March was 8 days, compared to 16 days in March 2020 and a previous 5-year average of 21 days.
Historical Sales By Property Type

Months Supply of Homes for Sale

Historical Median Sales Price – By Property Type

Historical Average Sales Price – By Property Type


If you are thinking of buying or selling in the coming months, wonder what the neighbor sold for, or have any questions at all, give me a call, text at 519-497-4646 or shoot me an email to kevinbaker@kwhometeam.ca.
Have a wonderful weekend and stay safe!
Kevin
Euphoria Continues in the Kitchener Waterloo Housing Market.
Hope you and your family have been doing well and everyone is staying safe. With lockdowns being lifted in many regions across Ontario, everyone is trying to get back to a normal life again. I will say that lockdowns or not, the housing market is starting to experience a little bit of euphoria from buyers in my opinion and certainly speculative buying. With many buyers especially from the GTA looking for homes in our region, it is pushing prices up fast.
Lets look at the stats from February…
There were 597 residential homes sold, an increase of 27.8 per cent compared to February 2020, and an increase of 66.7 per cent compared to the previous month. The previous 10-year average number of residential sales for February is 407.
Total residential sales in February included 337 detached (up 23.9 per cent from February 2020), and 101 condominium units (up 57.8 per cent). Sales also included 47 semi-detached homes (up 46.9 per cent) and 112 townhouses (up 13.1 per cent).
In February, the average sale price of all residential properties sold in 2021 increased by 32.1 per cent to $752,289 compared to the same month last year. Meanwhile, the average price of a detached home hit yet another new milestone by exceeding 900-thousand-dollars for the first time, coming in at $910,126 an increase of 35.4 per cent. During this same period, the average sale price for an apartment-style condominium was $415,322 for an increase of 11.9 per cent. Townhomes and semis sold for an average of $609,566 (up 37.5 per cent) and $684,787 (up 41.1 per cent) respectively.
We are continuing to see a dramatic increases in the average price in February due to the persistent and fierce competition for homes in our region combined with short supply, this is frustrating buyers in the hyper competitive market.
The low inventory and mortgage rates are resulting in multiple offers, higher prices and creating a fear they are missing out on the chance to become homeowners in this unprecedented market.
The rise in the average price we’ve been tracking the past several months has included some exceptional sale prices. That’s why this month and going forward we will also be including the MLS® HPI to provide a clearer picture of our local housing market trends.
The MLS® HPI is a sophisticated statistical model and more stable price indicator than average or median price measures because it considers how the features of a home affects its price – such as age, number of bedrooms, and number of bathrooms.
The MLS® Home Price Index composite benchmark price for all residential properties in Kitchener-Waterloo was $709,600 in February. This represents a 27.9 per cent increase over February 2020 and a 5.6 per cent increase compared to January 2021.
The benchmark price for a detached home was $788,500. This represents a 28.8 per cent increase from February 2020 and 6.1 per cent increase compared to January 2021.
The benchmark price for an apartment-style condominium was $341,200. This represents a 13.9 per cent increase from February 2020 and a 0.1 per cent increase compared to January 2021.
The benchmark price for a townhouse is $526,700. This represents a 33.1per cent increase from February 2020 and a 6 per cent increase compared to January 2021.
There were 737 new listings added to the MLS® System in KW and area last month, an increase of 21 per cent compared to February of last year, and a 15.7 per cent increase compared to the previous ten-year average for February.
The total number of homes available for sale in active status at the end of February was 295, a decrease of 33.6 per cent compared to February of last year, and 73 per cent below the previous ten-year average of 1,096 listings for February.
The number of months of inventory was 0.5 in February and has numbered less than 1 month since October. The number of months of inventory represents how long it would take to sell off current inventories at the current rate of sales.
The average number of days to sell in February was 10 days, compared to 17 days in February 2020 and a previous 5-year average of 33 days.
If you are thinking of buying or selling in the coming months, wonder what the neighbor sold for, or have any questions at all, give me a call, text at 519-497-4646 or shoot me an email to kevinbaker@kwhometeam.ca.
Have a wonderful weekend and stay safe!
Kevin
Home Sales Surge in July for Kitchener Waterloo and Cambridge
Hope you enjoyed a wonderful long weekend and the beautiful summer weather we have been having.
It was another crazy month for home prices here in Waterloo Region. Competition stays very high for buyers looking to lock down a house in July. With the rules around covid relaxing and more people getting out with Phase 3 opening the demand for homes has increased for sure.
There were 734 residential homes sold in July, an increase of 25.7 per cent compared to the same month last year, and well above the previous ten-year average for July of 531.
Total residential sales in July included 464 detached homes (up 39.3 per cent from July 2019), and 65 condominium apartments (up 3.2 per cent). Sales also included 153 townhouses (up 4.8 per cent) and 52 semi-detached homes (up 23.8 per cent).
The average sale price of all residential properties sold in July increased 22.8 per cent to $639,814 compared to the same month last year, while detached homes sold for an average price of $745,149 an increase of 21.4 per cent. During this same period, the average sale price for an apartment-style condominium was $392,770 for an increase of 15.2 per cent. Townhomes and semis sold for an average of $465,756 (up 12.8 per cent) and $522,872 (up 20.4 per cent) respectively.
The median price of all residential properties sold in July increased 21.7 per cent to $595,000 and the median price of a detached home during the same period increased 17.4 per cent to $675,000.
With mortgage rates near all time lows homebuyers remain very confident about owning a home in Waterloo Region and I expect this to contunie going into the fall.
There were 888 new listings added, an increase of 4.3 per cent compared to July of last year, and 15.5 per cent more than the previous ten-year average for July.
The total number of homes available for sale in active status at the end of July was 592, a decrease of 32.6 per cent compared to July of last year.
The number of Months Supply (also known as absorption rate) continues to be very low at just 1.3 months for the month of July, 27.8 per cent below the same period last year. The previous ten-year average supply of homes for July was 3.1 months, and in the past 5 years, the average supply for July was 2.1 months.
The average days to sell in July was 17 days, compared to 22 days in July 2019.
Historical Sales By Property Type

Months Supply of Homes for Sale
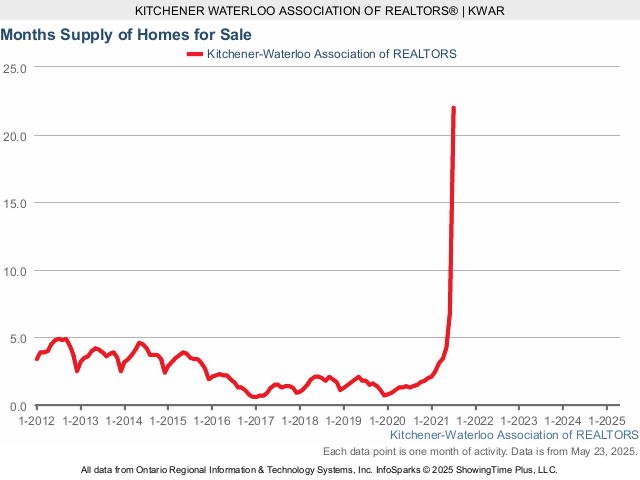
Historical Median Sales Price – By Property Type
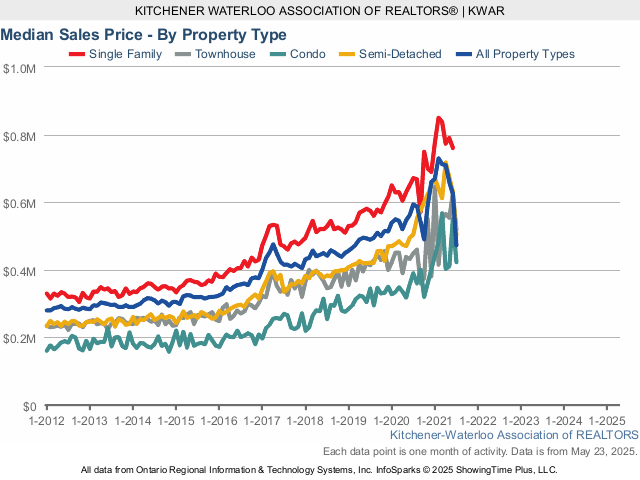
Historical Average Sales Price – By Property Type

Historical Sales – By Price Range
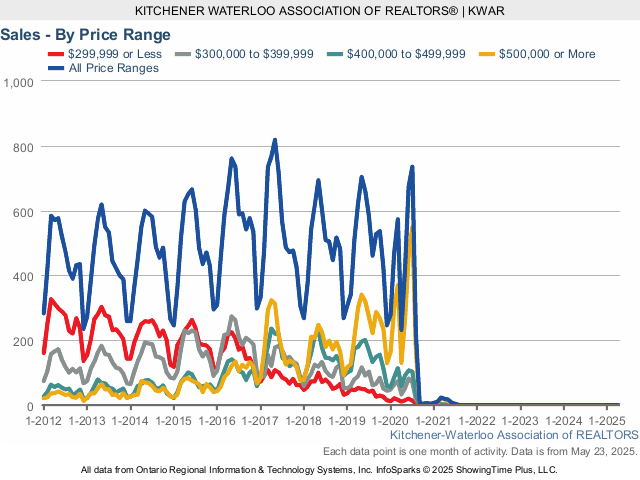
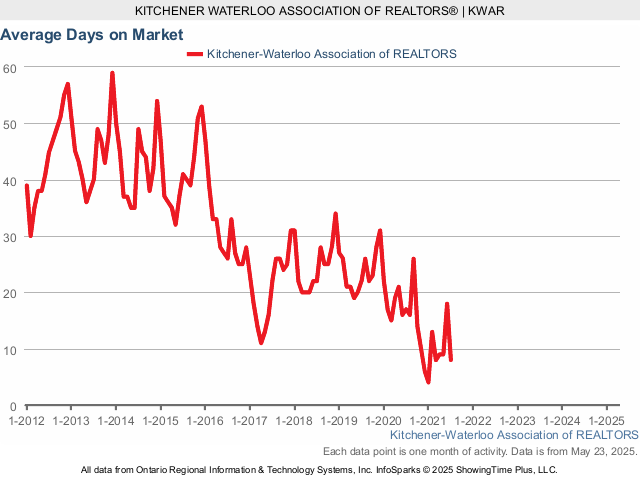
If you are thinking of buying or selling in the coming months or have any questions at all, give me a call, text at 519-497-4646 or shoot me an email to kevinbaker@kwhometeam.ca Stay healthy and stay safe!
Have a great weekend!
Kevin
