
Home Prices Continue to Cool in Kitchener Waterloo and Cambridge
I hope you and your family are starting to enjoy the holiday season. It’s wonderful that everyone can get together again and make new memories. Let’s hope that the snow stays away just a little longer but arrives just in time for Christmas!
The latest housing stats are out for Waterloo Region, lets take a look at what the numbers have to say…
There were 453 homes sold in November, a decrease of 43.7 per cent compared to November 2021 and 34.2 per cent below the previous 5-year average for the month.
Total residential sales in November included 280 detached (down 38.3 per cent from November 2021), and 78 townhouses (down 57.1 per cent). Sales also included 58 condominium units (down 49.6 per cent) and 37 semi-detached homes (down 28.8 per cent).
As they traditionally do at this time of year, home sales have decreased, at the same time, we know ever-increasing homeownership costs are contributing to the decline and putting downward pressure on sales prices which have plateaued since July.
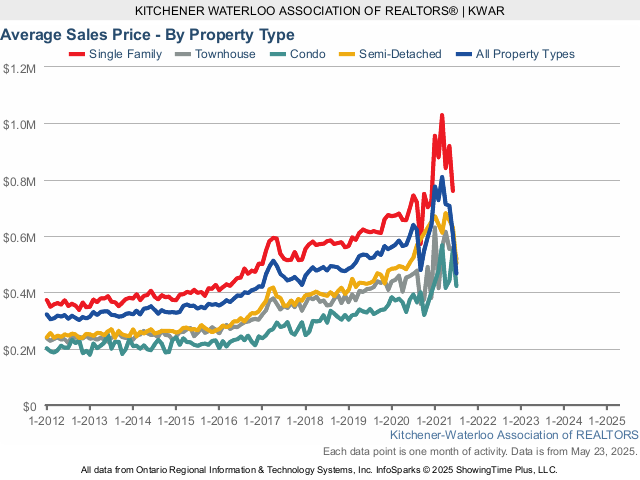
In November, the average sale price for all residential properties in Waterloo Region was $736,024. This represents a 10.4 per cent decrease compared to November 2021 and a 3.6 per cent decrease compared to October 2022.
- The average price of a detached home was $838,609. This represents a 13.1 per cent decrease from November 2021 and a decrease of 3.5 per cent compared to October 2022.
- The average sale price for a townhouse was $618,669. This represents a 12.3 per cent decrease from November 2021 and a decrease of 2.6 per cent compared to October 2022.
- The average sale price for an apartment-style condominium was $458,384. This represents a decrease of 7.5 per cent from November 2021 and a decrease of 6.2 per cent compared to October 2022.
- The average sale price for a semi was $642,328. This represents a decrease of 9.4 per cent compared to November 2021 and an increase of 3.2 per cent compared to October 2022.

| MLS® Home Price Index Benchmark Price | ||||||
| Kitchener-Waterloo | Cambridge | |||||
| Benchmark Type: | November 2022 | Monthly % Change | Yr./Yr. % Change | November 2022 | Monthly % Change | Yr./Yr. % Change |
| Composite | $711,200 | -1.7 | -12.8 | $744,200 | 1.8 | -10.6 |
| Detached | $791,000 | -2.1 | -14.8 | $770,600 | 2.5 | -12.0 |
| Townhouse | $602,200 | -0.2 | -7.0 | $652,000 | -1.7 | -2.0 |
| Apartment | $492,600 | -0.4 | 8.0 | $504,100 | -3.1 | 3.7 |

The Waterloo Region market has been moving towards more of a balanced market throughout the latter part of the year, and November has followed that trend. We have a long way to go before the pendulum swings into it being a buyer’s market. However, if the Bank of Canada yet again raises its key interest rate on December 7, it is likely to result in fewer buyers competing for more inventory.
There were 752 new listings added last month, a decrease of 6.6 per cent compared to November of last year and a 1.3 per cent increase compared to the previous ten-year average for November.
The total number of homes available for sale in active status at the end of November was 860, an increase of 209.4 per cent compared to November of last year and 29.9 per cent below the previous ten-year average of 1227 listings for November.
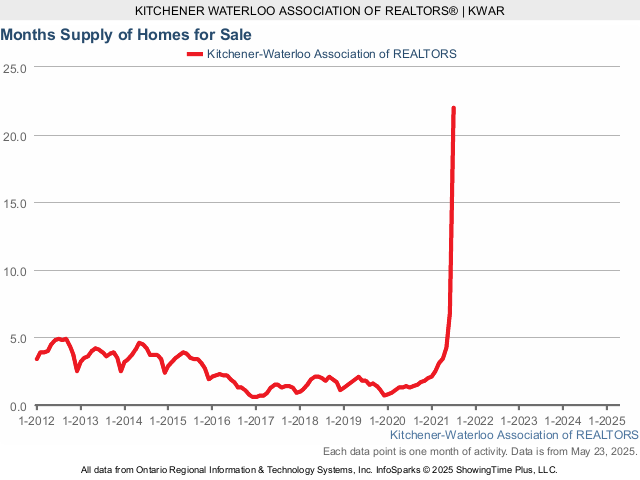
The number of months of inventory is up 333.3 per cent compared to November of last year, but still historically low at 1.3 months. Between 2009 and 2015, November’s average months of inventory was 3.2 months. The number of months of inventory represents how long it would take to sell off current inventories at the current sales rate.
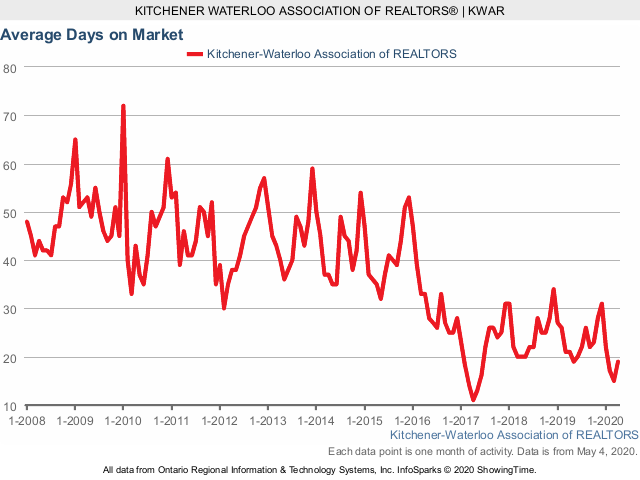
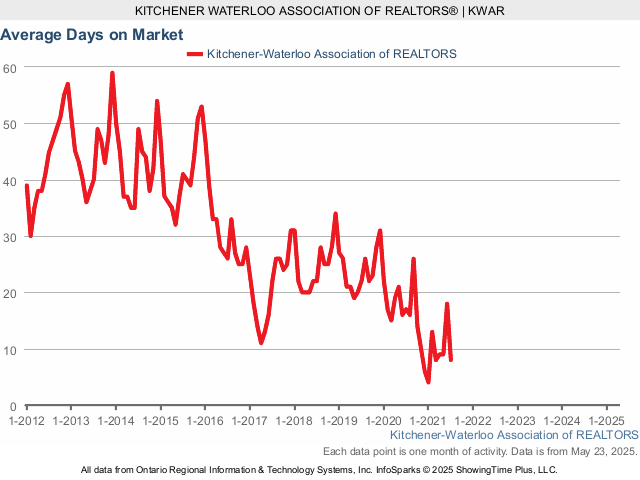
The average number of days to sell in November was 21, compared to 10 days in November 2021. The previous 5-year average is 21 days.
Average Sales Price – Municipality

Average Sales Price – Township

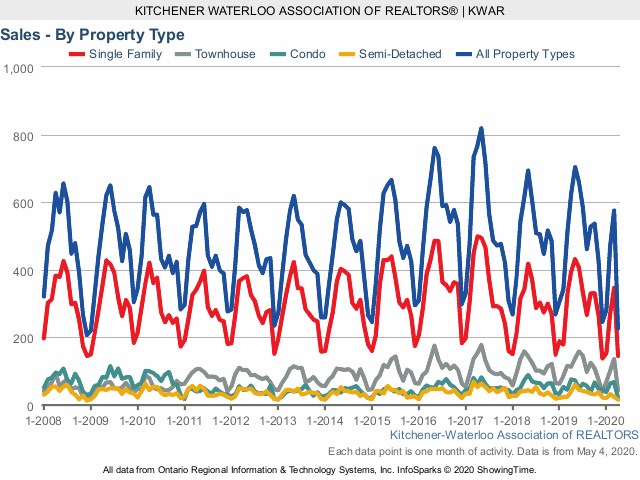
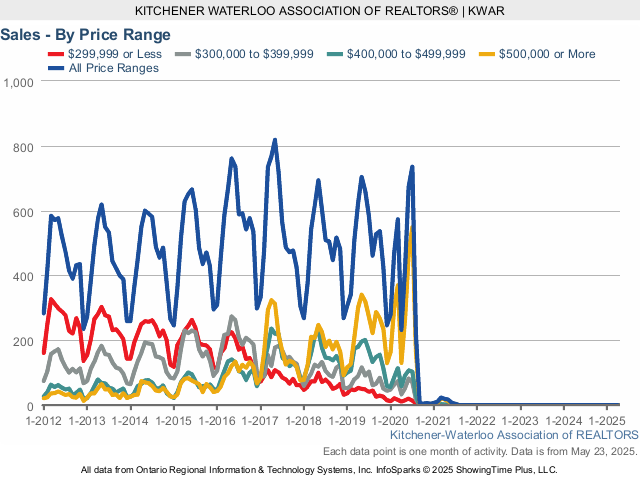
Monthly Sales By Property Type

Monthly Supply of Homes for Sale

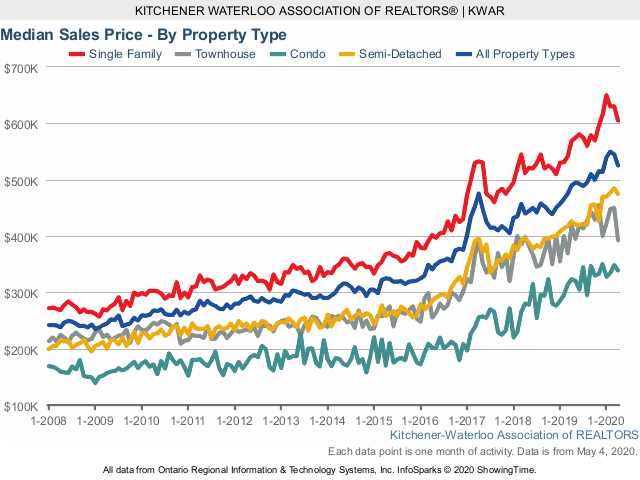
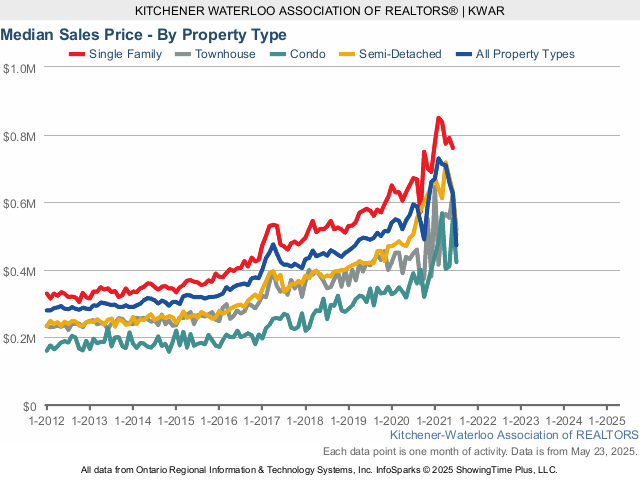
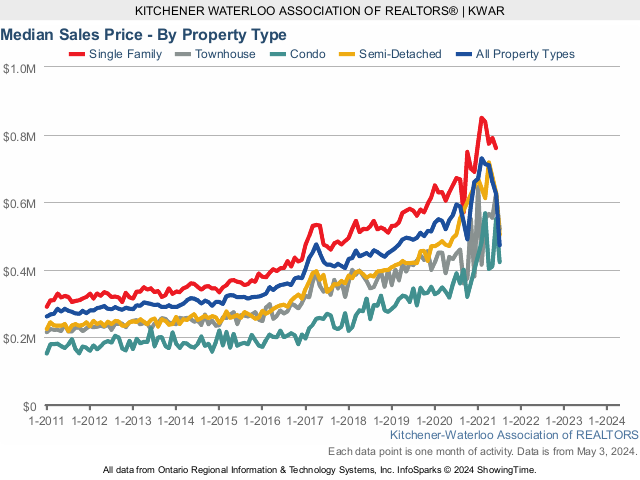
Monthly Median Sales Price – By Property Type

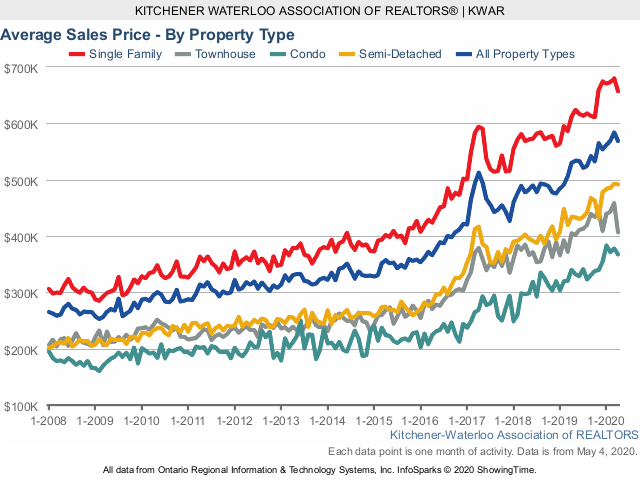
Monthly Average Sales Price – By Property Type

Monthly Average Days on Market

If you are thinking of buying or selling in the next few months or into to spring of 2023, wondering what the neighbor’s place sold for, or have any questions at all, give me a call, text at 519-497-4646 or shoot me an email to kevinbakerrealestate@gmail.com
Enjoy a wonderful holiday season with your family and friends!
Kevin
Home Sales Decline but Prices Hold Steady in Kitchener Waterloo and Cambridge
Happy Thanksgiving! I hope you and your family are able to spend a wonderful holiday together. The weather looks great for the rest of weekend and with the leaves starting to turn fall is certainly here.
The stats are out for September and sales were down considerably over last year and the 5 year average, but prices are starting to hold these levels and have been relatively flat the last 2 months.
There were 518 residential homes were sold last month, a decrease of 25.3 per cent compared to September 2021 and 30.8 per cent below the previous 5-year average for the month.
Total residential sales in September included 313 detached (down 18.9 per cent from September 2021), and 94 townhouses (down 39.0 per cent). Sales also included 60 condominium units (down 37.5 per cent) and 51 semi-detached homes (down 8.9 per cent).
Interest rate hikes have continued to put pressure on the housing market as a whole. The property type that saw the biggest decline in sales was the townhouse segment followed closely by condos, which could indicate there are fewer entry-level buyers in the market due to the higher borrowing costs.
In September, the average sale price for all residential properties in Waterloo Region was $752,421. This represents a 4.7 per cent decrease compared to September 2021 and a 0.1 per cent increase compared to August 2022.
- The average price of a detached home was $862,435. This represents a 7.4 per cent decrease from September 2021 and an increase of 1.3 per cent compared to August 2022.
- The average sale price for a townhouse was $638,284. This represents a 2.7 per cent decrease from September 2021 and an increase of 4.4 per cent compared to August 2022.
- The average sale price for an apartment-style condominium was $455,262. This represents a decrease of 8.5 per cent from September 2021 and a decrease of 2.3 per cent compared to August 2022.
- The average sale price for a semi was $637,205. This represents a decrease of 6.5 per cent compared to September 2021 and a decrease of 2.8 per cent compared to August 2022.

| MLS® Home Price Index Benchmark Price | ||||||
| Kitchener-Waterloo | Cambridge | |||||
| Benchmark Type: | September 2022 | Monthly % Change | Yr./Yr. % Change | September 2022 | Monthly % Change | Yr./Yr. % Change |
| Composite | $724,600 | -1.3 | -6.7 | $748,000 | -0.4 | -3.7 |
| Detached | $807,700 | -0.9 | -8.4 | $768,100 | 0.4 | -5.3 |
| Townhouse | $611,600 | -1.1 | 1.8 | $679,300 | -5.0 | 5.8 |
| Apartment | $493,800 | -3.9 | 9.7 | $556,600 | -3.8 | 16.5 |

While sales were down last month, we seem to be moving towards a more balanced market; buyers now have more inventory to choose from, yet sellers can still expect their properties to sell within a reasonable timeframe. We’re also observing that sale prices are shifting closer to the asking price. Furthermore, the sales-to-new listings ratio of 56.4 per cent in September compared to 70.8 per cent in August. (According to CMHC, a sales-to-new-listings ratio above 55 per cent is associated with a sellers’ market, while an overheating market corresponds to the upper range of a sellers’ market, with a ratio exceeding 70 per cent).
There were 918 new listings added last month, a decrease of 3.6 per cent compared to September of last year and a 15.9 per cent decrease compared to the previous ten-year average for September.
The total number of homes available for sale in active status at the end of September was 978, an increase of 108.5 per cent compared to September of last year and 35.4 per cent below the previous ten-year average of 1515 listings for September.
The number of months of inventory is up 180.0 per cent compared to September of last year, but still historically low at 1.4 months. Between 2009 and 2015, the average number of months of inventory for September was 3.7 months. The number of months of inventory represents how long it would take to sell off current inventories at the current sales rate.
The average number of days to sell in September was 23, compared to 10 days in September 2021. The previous 5-year average is 20 days. Average Sales Price – Municipalit

Average Sales Price – Township

Monthly Sales By Property Type

Monthly Supply of Homes for Sale

Monthly Median Sales Price – By Property Type

Monthly Average Sales Price – By Property Type

Monthly Average Days on Market

If you are thinking of buying or selling this fall, wondering what the neighbor’s place sold for, or have any questions at all, give me a call, text at 519-497-4646 or shoot me an email to kevinbakerrealestate@gmail.com
Enjoy the fall colors and have a wonderful Thanksgiving with your family.
Kevin
Rising Rates Continues To Put Pressure On Home Prices in Kitchener Waterloo and Cambridge
I hope you and your family are doing well and enjoying the beautiful summer weather we are having. With the kids going back to school they must be so excited to reunite with friends again now that covid restrictions are easing and things seem to be back to normal.
Given that school is now back in session, buyers focus will again turn to the real estate market. Rates are continuing to rise so hopefully we will see the market bottom soon and hold steady. Please keep in mind the stats are now including cambridge board as well with the amalgamation of Kitchener Waterloo and Cambridge. Lets take a look….
There were 659 residential homes were sold in August, a decrease of 8.1 per cent compared to August 2021 and 11.2 per cent below the previous 5-year average for the month.
Total residential sales in August included 413 detached (down 0.7 per cent from August 2021), and 117 townhouses (down 24.0 per cent). Sales also included 68 condominium units (down 26.1 per cent) and 61 semi-detached homes (up 10.9 per cent).
While the number of homes sold in August was down on a year-over-year basis they were up almost 19 per cent compared to July. The decline was most pronounced in the apartment-style condo and townhouse categories which could indicate that rising borrowing costs are having a greater impact on first-time buyers and those looking for more affordable options.
In August, the average sale price for all residential properties in Waterloo Region was $750,849. This represents a 0.4 per cent decrease compared to August 2021 and a 0.2 per cent decrease compared to July 2022.
- The average price of a detached home was $851,654. This represents a 3.0 per cent decrease from August 2021 and an increase of 1.1 per cent compared to July 2022.
- The average sale price for a townhouse was $610,725. This represents a 4.2 per cent decrease from August 2021 and a decrease of 5.2 per cent compared to July 2022.
- The average sale price for an apartment-style condominium was $464,959. This represents an increase of 4.3 per cent from August 2021 and a decrease of 10.9 per cent compared to July 2022.
- The average sale price for a semi was $655,813. This represents a decrease of 1.0 per cent compared to August 2021 and a decrease of 0.8 per cent compared to July 2022.

WRAR cautions that average sale price information can be useful in establishing long-term trends but should not be used as an indicator that specific properties have increased or decreased in value. The MLS® Home Price Index (HPI) provides the best way to gauge price trends because averages are strongly distorted by changes in the mix of sales activity from one month to the next.
| MLS® Home Price Index Benchmark Price | ||||||
| Kitchener-Waterloo | Cambridge | |||||
| Benchmark Type: | August 2022 | Monthly % Change | Yr./Yr. % Change | August 2022 | Monthly % Change | Yr./Yr. % Change |
| Composite | $734,500 | -1.9 | -2.2 | $750,700 | -3.4 | 0.6 |
| Detached | $815,000 | -1.5 | -3.9 | $764,700 | -3.1 | -1.3 |
| Townhouse | $618,400 | -3.8 | 5.4 | $715,200 | -5.9 | 11.7 |
| Apartment | $513,600 | -2.1 | 16.1 | $578,500 | -1.1 | 19.0 |

The announcement by the Bank of Canada to increase its policy rate by 75 basis points to 3.25 per cent is discouraging news for borrowers as it affects their purchasing power, however, we see signs that the market is moving towards more buyer-friendly conditions. There are fewer multiple offers resulting in final sale prices being closer to the asking price or with more conditions accompanying offers. Even so, with inventory still very tight.
There were 933 new listings added last month, an increase of 19.3 per cent compared to August of last year, and a 1.2 per cent increase compared to the previous ten-year average for August.
The total number of homes available for sale in active status at the end of August was 1,003, an increase of 188.2 per cent compared to August of last year, and 31.8 per cent below the previous ten-year average of 1593 listings for August.
The number of months of inventory is up 250 per cent compared to August of last year, but still historically low. There were 1.4 months of inventory in August 2022, down from 1.8 months in July 2022. The number of months of inventory represents how long it would take to sell off current inventories at the current sales rate.
The average number of days to sell in August was 22, compared to 12 days in August 2021. The previous 5-year average is 22 days.
Average Sales Price – Municipality

Average Sales Price – Township

Monthly Sales By Property Type

Monthly Supply of Homes for Sale

Monthly Median Sales Price – By Property Type

Monthly Average Sales Price – By Property Type

Monthly Average Days on Market

If you are thinking of buying or selling this fall, wondering what the neighbor’s place sold for, or have any questions at all, give me a call, text at 519-497-4646 or shoot me an email to kevinbakerrealestate@gmail.com
Enjoy the nice weather and have a great September!
Kevin
HOME SALES CONTINUE TO HUM ALONG IN JULY IN KITCHENER WATERLOO
Hope you and your family are enjoing your summer. The weather this weekend has been beautiful so i hope you have been able to get out and enjoy it.
The Real estate market here in Waterloo region continues to show incredible strength with low invetory and strong demand which is keeping prices humming in July.
The was a total of 611 residential homes sold last month, a decrease of 17 per cent compared to the record-setting results of July 2020, but still an above-average number of sales for the month of July.
Total residential sales in July included 339 detached (down 27.1 per cent from July 2020), and 91 condominium units (up 30 per cent). Sales also included 46 semi-detached homes (down 4.2) and 135 townhouses (down 11.8 per cent).
In July, the average sale price for all residential properties in the Kitchener-Waterloo area was $755,681. This represents a 18.2 per cent increase over July 2020 and a 0.6 per cent decrease compared to June 2021.
- The average price of a detached home was $907,192. This represents a 21.9 per cent increase from July 2020 and a decrease of 1.4 per cent compared to June 2021.
- The average sale price for an apartment-style condominium was $429,630. This represents an increase of 6.7 per cent from July 2020 and a decrease of 3.6 per cent compared to June 2021.
- The average sale price for a townhouse was $623,732. This represents a 33.8 per cent increase from July 2020 and an increase of 5.4 per cent compared to June 2021.
- The average sale price for a semi was $667,570. This represents an increase of 28.6 per cent compared to July 2020 and an increase of 2.9 per cent compared to June 2021.

The MLS® HPI composite benchmark price for all residential properties in Kitchener-Waterloo was $748,700 in July. This represents a 30.5 per cent increase over July 2020 and a 0.4 per cent increase compared to June 2021.
- The benchmark price for a detached home was $822,300. This represents a 31.1 per cent increase from July 2020 and 0.2 per cent increase compared to June 2021.
- The benchmark price for an apartment-style condominium was $385,900. This represents a 19.5 per cent increase from July 2020 and a 3.3 per cent increase compared to June 2021.
- The benchmark price for a townhouse is $564,500. This represents a 40 per cent increase from July 2020 and a 0.4 per cent decrease compared to June 2021.

The housing market took a bit of a breather last month and July is typically a quieter month with families taking vacation, and with the region coming out of lockdown there were certainly more staycations happening. But we do anticipate the market will pick up steam again and it will be another busy fall.
There were 675 new listings added to the MLS® System in KW and area last month, a decrease of 24 per cent compared to July of last year, and a 14.4 per cent decrease compared to the previous ten-year average for July.
The total number of homes available for sale in active status at the end of July was 281, a decrease of 52.7 per cent compared to July of last year, and 79.1 per cent below the previous ten-year average of 1,346 listings for July.
The number of months of inventory was 0.4 in July, a decline from 0.5 months in June. Inventory has numbered less than 1 month since October. The number of months of inventory represents how long it would take to sell off current inventories at the current rate of sales.
The average number of days to sell in July was 11 days, compared to 17 days in July 2020 and a previous 5-year average of 22 days.
Historical Sales By Property Type

Months Supply of Homes for Sale

Historical Median Sales Price – By Property Type

Historical Average Sales Price – By Property Type


If you are thinking of buying or selling in the coming months, wonder what the neighbor sold for, or have any questions at all, give me a call, text at 519-497-4646 or shoot me an email to kevinbaker@kwhometeam.ca.
Have a wonderful rest of the weekend and stay safe!
Kevin
April Home Sales 2nd Highest on Record in Kitchener, Waterloo and Cambridge
Hope you and your family have been doing well. How are you surviving the lockdown? Personally this whole covid thing is getting a little old and I wish things could just go back to normal as i am sure you do too.
As for the Real estate market it is still going exceptionally strong and we had the 2nd highest sales on record for April!
Lets look at the stats…
Following last month’s record-smashing number of home sales, we posted the second-highest number of monthly home sales in April. There were 843 residential homes sold, an increase of 263.4 per cent compared to April 2020, and a decrease of 15.5 per cent compared to March 2021.
Even if we do not take into account April 2020, when Ontario was in the early days of its state of emergency, it was still an exceptional number of homes sold last month. The previous 10-year average number of residential sales for April was 618.
Total residential sales in April included 484 detached (up 233.8 per cent from April 2020), and 111 condominium units (up 382.6 per cent). Sales also included 67 semi-detached homes (up 294.1 per cent) and 181 townhouses (up 285.1 per cent).
In April, the average sale price for all residential properties in the Kitchener-Waterloo area was $757,906. This represents a 34.3 per cent increase over April 2020 and a 0.9 per cent decrease compared to March 2021.
- The average price of a detached home was $899,315. This represents a 36.9 per cent increase from April 2020 and an increase of 0.04 per cent compared to March 2021.
- The average sale price for an apartment-style condominium was $441,887. This represents an increase of 21.2 per cent from April 2020 and an increase of 4.2 per cent compared to March 2021.
- The average sale price for a townhouse was $612,550. This represents a 52.1 per cent increase from April 2020 and a decrease of 2.03 per cent compared to March 2021.
- The average sale price for a semi was $652,609. This represents an increase of 33.0 per cent compared to April 2020 and an increase of 0.18 per cent compared to March 2021.
We are starting to see home prices calm down in March and April compared to what was happening in January and February which is great news for buyers.

The MLS® HPI composite benchmark price for all residential properties in Kitchener-Waterloo was $742,800 in April. This represents a 40.4 per cent increase over April 2020 and a 0.6 per cent increase compared to March 2021.
- The benchmark price for a detached home was $809,000. This represents a 39.9 per cent increase from April 2020 and 1.0 per cent decrease compared to March 2021.

There were 1,098 new listings last month, an increase of 162.7 per cent compared to April of last year, and a 17.15 per cent increase compared to the previous ten-year average for April* (*calculated from 2019 to 2010 to adjust for the impact of the state of emergency on activity in April 2020).
The total number of homes available for sale in active status at the end of April was 458, a decrease of 21.8 per cent compared to April of last year, and 66.9 per cent below the previous ten-year average of 1,384 listings for April* (*calculated from 2010 to 2019 to adjust for the impact of the state of emergency on activity in April 2020).
The number of months of inventory was 0.7 in April, which is unchanged from March. Inventory has numbered less than 1 month since October. The number of months of inventory represents how long it would take to sell off current inventories at the current rate of sales.
The average number of days to sell in April was 9 days, compared to 19 days in April 2020 and a previous 5-year average of 21 days.
If you are thinking of buying or selling in the coming months, wonder what the neighbor sold for, or have any questions at all, give me a call, text at 519-497-4646 or shoot me an email to kevinbaker@kwhometeam.ca.
Have a wonderful weekend and stay safe!
Kevin
Historical Sales By Property Type

Months Supply of Homes for Sale

Historical Median Sales Price – By Property Type

Historical Average Sales Price – By Property Type


Record Breaking Home Sales for March in Kitchener Waterloo
Hope you and your family have been doing well and everyone is staying safe. Unfortunatley lockdowns are back for the next 4 weeks so i hope that things will get back to some kind of normal at some point this year.
As for the Real estate market it is still going exceptionally strong and we broke a total sales record in March! Even though everyone is saying there is no inventory that is not the case. There is lots of inventory but the buyers still out number the sellers with all the GTA buyers coming to scoop up properties.
Lets look at the stats from March…
March posted the highest number of monthly home sales in the board’s history. There were 993 residential homes sold, an increase of 72.7 per cent compared to March 2020, and an increase of 66 per cent compared to the previous month. The previous 10-year average number of residential sales for March is 552.
Total residential sales in March included 593 detached (up 69.4 per cent from March 2020), and 124 condominium units (up 82.4 per cent). Sales also included 79 semi-detached homes (up 216 per cent) and 197 townhouses (up 49.2 per cent).
In March, the average sale price for all residential properties in the Kitchener-Waterloo area was $765,393. This represents a 30.8 per cent increase over March 2020, and a 1.5 per cent increase compared to February 2021.
- The average price of a detached home was $899,460. This represents a 32.3 per cent increase from March 2020, and a decrease of 1.4 per cent compared to February 2021.
- The average sale price for an apartment-style condominium was $423,470. This represents an increase of 12 per cent from March 2020, and an increase of 1.6 per cent compared to February 2021.
- The average sale price for a townhouse was $622,258. This represents a 35.9 per cent increase from March 2020, and an increase of 2 per cent compared to February 2021.
- The average sale price for a semi was $652,669. This represents an increase of 32.5 per cent compared to March 2020, and a decrease of 4.8 per cent compared to February 2021.
On a year-over-year basis we continued to see huge price increases in the average price in March, however compared to February we are seeing some signs that perhaps prices may be starting to stabilize a bit.
The MLS® HPI composite benchmark price for all residential properties in Kitchener-Waterloo was $738,200 in March. This represents a 33.4 per cent increase over March 2020 and a 4 per cent increase compared to February 2021.
- The benchmark price for a detached home was $817,000. This represents a 34.4 per cent increase from March 2020 and 3.6 per cent increase compared to February 2021.
- The benchmark price for an apartment-style condominium was $358,700. This represents a 14.9 per cent increase from March 2020 and a 5.1 per cent increase compared to February 2021.
- The benchmark price for a townhouse is $554,900. This represents a 38.3 per cent increase from March 2020 and a 5.4 per cent increase compared to February 2021.
In addition to the record number of sales in March, we also had a record number of newly listed properties come on the market. The number of new listings last month was the most of any month, and the highest number since May of 2017 when there were 1,271 new listings.
There were 1,359 new listings added to the MLS® System in KW and area last month, an increase of 56.2 per cent compared to March of last year, and a 63.9 per cent increase compared to the previous ten-year average for March.
The total number of homes available for sale in active status at the end of March was 434, a decrease of 23.5 per cent compared to March of last year, and 63.5 per cent below the previous ten-year average of 1,188 listings for March.
The number of months of inventory was 0.7 in March and has numbered less than 1 month since October. The number of months of inventory represents how long it would take to sell off current inventories at the current rate of sales.
The average number of days to sell in March was 8 days, compared to 16 days in March 2020 and a previous 5-year average of 21 days.
Historical Sales By Property Type

Months Supply of Homes for Sale

Historical Median Sales Price – By Property Type

Historical Average Sales Price – By Property Type


If you are thinking of buying or selling in the coming months, wonder what the neighbor sold for, or have any questions at all, give me a call, text at 519-497-4646 or shoot me an email to kevinbaker@kwhometeam.ca.
Have a wonderful weekend and stay safe!
Kevin
It Was A Crazy January Real Estate Market in Kitchener Waterloo and Cambridge!
Hope you and your family have been doing well and everyone is staying safe. With the lockdowns in place and the kids home from school it is definitely a different winter season indeed. There is some great news though… the Waterloo Region real estate market is still on FIRE! The average price of a detached home in the region hits a new milstone… Breaking $800,000… WOW!!!
There were 351 residential homes sold in January, an increase of 24.9 per cent compared to January 2020, and an increase of 1.4 per cent compared to the previous month. The previous 10-year average number of residential sales for January is 286.
Total residential sales in January included 201 detached (up 31.3 per cent from January 2020), and 71 condominium units (up 97 per cent). Sales also included 21 semi-detached homes (unchanged) and 56 freehold townhouses (down 17.6 per cent).
In January, the average sale price of all residential properties sold in 2021 increased by 23.9 per cent to $695,582 compared to the same month last year. Meanwhile, the average price of a detached home hit a new milestone by exceeding 800-thousand-dollars for the first time, coming in at $853,945 an increase of 27.3 per cent. During this same period, the average sale price for an apartment-style condominium was $383,196 for a decrease of 1.4 per cent. Townhomes and semis sold for an average of $566,345 (up 29 per cent) and $626,512 (up 29.3 per cent) respectively.
The median price of all residential properties sold in January increased 25.9 per cent to $680,000 and the median price of a detached home during the same period increased 23.3 per cent to $801,500.
With demand for homes in the region very strong, the consumer preference is leaning predominantly toward single detached homes. In January we saw buyers paying a premium for this property type, Conversely, even as condo sales were increasing in January, we saw prices for this style of housing soften by comparison.
Supply is just not able to keep up with continuing demand, much of it coming from the GTA, for the strong increases in home prices in Waterloo Region and in many other parts across the province. The number of months of inventory in Waterloo region has numbered less than 1 month since October. The number of months of inventory represents how long it would take to sell off current inventories at the current rate of sales.
There were 432 new listings added to the MLS® System in KW and area last month, a decrease of 7.4 per cent compared to January of last year, and 37.6 per cent decrease compared to the previous ten-year average for January.
The average number of days to sell in January was 16 days, compared to 22 days in January 2020 and a previous 5-year average of 30 days

If you are thinking of buying or selling in the coming months, wonder what the neighbor sold for, or have any questions at all, give me a call, text at 519-497-4646 or shoot me an email to kevinbaker@kwhometeam.ca.
Have a wonderful weekend and stay safe!
Kevin
Home Sales Surge in July for Kitchener Waterloo and Cambridge
Hope you enjoyed a wonderful long weekend and the beautiful summer weather we have been having.
It was another crazy month for home prices here in Waterloo Region. Competition stays very high for buyers looking to lock down a house in July. With the rules around covid relaxing and more people getting out with Phase 3 opening the demand for homes has increased for sure.
There were 734 residential homes sold in July, an increase of 25.7 per cent compared to the same month last year, and well above the previous ten-year average for July of 531.
Total residential sales in July included 464 detached homes (up 39.3 per cent from July 2019), and 65 condominium apartments (up 3.2 per cent). Sales also included 153 townhouses (up 4.8 per cent) and 52 semi-detached homes (up 23.8 per cent).
The average sale price of all residential properties sold in July increased 22.8 per cent to $639,814 compared to the same month last year, while detached homes sold for an average price of $745,149 an increase of 21.4 per cent. During this same period, the average sale price for an apartment-style condominium was $392,770 for an increase of 15.2 per cent. Townhomes and semis sold for an average of $465,756 (up 12.8 per cent) and $522,872 (up 20.4 per cent) respectively.
The median price of all residential properties sold in July increased 21.7 per cent to $595,000 and the median price of a detached home during the same period increased 17.4 per cent to $675,000.
With mortgage rates near all time lows homebuyers remain very confident about owning a home in Waterloo Region and I expect this to contunie going into the fall.
There were 888 new listings added, an increase of 4.3 per cent compared to July of last year, and 15.5 per cent more than the previous ten-year average for July.
The total number of homes available for sale in active status at the end of July was 592, a decrease of 32.6 per cent compared to July of last year.
The number of Months Supply (also known as absorption rate) continues to be very low at just 1.3 months for the month of July, 27.8 per cent below the same period last year. The previous ten-year average supply of homes for July was 3.1 months, and in the past 5 years, the average supply for July was 2.1 months.
The average days to sell in July was 17 days, compared to 22 days in July 2019.
Historical Sales By Property Type

Months Supply of Homes for Sale

Historical Median Sales Price – By Property Type

Historical Average Sales Price – By Property Type

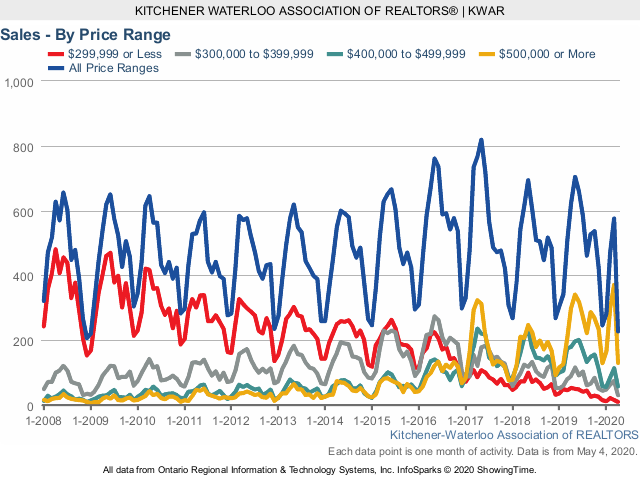
Historical Sales – By Price Range


If you are thinking of buying or selling in the coming months or have any questions at all, give me a call, text at 519-497-4646 or shoot me an email to kevinbaker@kwhometeam.ca Stay healthy and stay safe!
Have a great weekend!
Kevin
April Home Sales Down but Prices Remain Steady in Waterloo Region
Hope you have been staying safe during the past 2 months. It looks like things will start to open back up in stages and at some point things will be hopefully back to normal. Rest assured Yogi and I are here to help if you and your family need to make a move and we have the tools and systems in place for both buyers and sellers for proper marketing of our listings, getting buyers to view the properties, as well as ourselves to keep everyone safe.
I thought you would like an update on what is happening out there in the Waterloo Region Real Estate Market, so here are the stats for April.
There were 227 residential homes sold through the Multiple Listing System in April, a decrease of 63.6 per cent compared to the same month last year, and the lowest number of sales in a single month since December 2008.
I think it goes without saying the current pandemic has had a major impact on the number of sales we would normally see in April, with everyone doing their part to flatten the curve and doing their best to self-isolate, the buying and selling of homes have been greatly reduced.
Total residential sales in April included 145 detached homes (down 63.3 per cent), and 22 condominium apartments (down 71.1 per cent). Sales also included 44 townhouses (down 61.1 per cent) and 16 semi-detached homes (down 60 per cent).
The average sale price of all residential properties sold in April increased 7.3 per cent to $568,738 compared to the same month last year, while detached homes sold for an average price of $657,042 an increase of 7.3 per cent. During this same period, the average sale price for an apartment-style condominium was $367,230 for an increase of 8.1 per cent. Townhomes and semis sold for an average of $406,463 (up 0.4 per cent) and $491,816 (up 13.3 per cent) respectively.
The median price of all residential properties sold in April increased by 7.1 per cent to $525,000 and the median price of a detached home during the same period increased 6.3 per cent to $605,000.
There were 417 new listings added to the MLS® System in KW and area last month, a decrease of 54.8 per cent compared to April of 2019, far fewer than the previous 10-year average of 937 listings in April.
The total number of homes available for sale in active status at the end of April was 571, a decrease of 36.6 per cent compared to April of last year.
The number of Months Supply (also known as absorption rate) continues to be very low at just 1.2 months for the month of April, 36.8 per cent below the same period last year. The previous ten-year average supply of homes for April was 2.95 months, and in the past 5 years, the average supply for April was 2.12 months.
I am confident that despite the current pandemic, the slowdown in housing sales will be temporary. We are still in a strong sellers’ market and with buyers competing for a scare number of listings, now is still a great time to buy. Now for the first time in a long time, April saw some balance with a sales-to-new-listings ratio of 54 percent – well within the balanced threshold. I have talked to some buyers expecting homes to sell at greatly reduced amounts, and frankly, that’s simply not the case. Home values have remained stable which I expect will continue into 2020.
The average days to sell in April was 19 days, compared to 21 days in April 2019.
Historical Sales By Property Type
Months Supply of Homes for Sale

Historical Median Sales Price – By Property Type
Historical Average Sales Price – By Property Type
Historical Sales – By Price Range
If you have any questions or concerns at all, give me a call or text at 519-497-4646 or shoot me an email to kevinbaker@kwhometeam.ca . Stay healty and stay safe!
Have a great week!
Kevin
Home Sales in Kitchener Waterloo come in Like a lion and out like a Lamb in March
Hope you have been staying safe during this unique time in all our lives. Rest assured Yogi and I are doing everthing we can to prevent the spread by staying home as much as posssible and limiting client interactions to phone calls, facetime, zoom meetings, etc. We are both here to help if you and your family need to make a move and we have the tools and systems in place for both buyers and sellers for proper marketing of our listings, getting buyers to view the properties, as well as ourselves to keep everyone safe.
I thought you would like an update on what is happening out there in the Waterloo Region Real Estate Market, so here are the stats for March.
There were 577 residential homes sold in March, an increase of 13.1 per cent compared to the same month last year, and 0.2 per cent below the previous 5-year average.
During the first quarter of 2020, there were 1,327 home sales, 14.6 per cent above last year’s result for the same period and 4 per cent above the previous 5-year average.
Total residential sales in March included 348 detached homes (up 7.1 per cent), and 68 condominium apartments (up 5.1 per cent). Sales also included 136 townhouses (up 17.2 per cent) and 25 semi-detached homes (up 4.2 per cent).
The average sale price of all residential properties sold in March increased 15.3 per cent to $583,752 compared to the same month last year, while detached homes sold for an average price of $679,728 an increase of 15.9 per cent. During this same period, the average sale price for an apartment-style condominium was $378,443 for an increase of 17.9 per cent. Townhomes and semis sold for an average of $457,547 (up 23 per cent) and $492,752 (up 17.4 per cent) respectively.
The median price of all residential properties sold in March increased 14.6 per cent to $544,500 and the median price of a detached home during the same period increased 16.2 per cent to $628,500.
Now of course is this not business as usual for us as Realtors or our clients. As people everywhere follow instructions to only leave their homes for essential reasons, this is impacting the number of showings, and how properties are shown.
There were a higher than average number of homes listed during the Month of March. There were 864 new listings added to the MLS® System in KW and area last month, an increase of 7.6 per cent compared to March of 2019, and the greatest number since 2015. The number of new residential listings was also 3.7 per cent higher than the previous ten-year average for March.
The total number of homes available for sale in active status at the end of March was 535, a decrease of 35.9 per cent compared to March of last year.
Despite the much-needed addition of new inventory coming to the market, the number of Months Supply (also known as absorption rate) continues to be very low at just 1.1 months for the month of March, 35.3 per cent below the same period last year. The previous ten-year average supply of homes for March was 2.73 months, and in the past 5 years, the average supply for March was 1.94 months.
There were also 51 listings last month that were suspended, which means the listing is temporarily “off-market,” and there can be no marketing, showings or offers during this period.
Trying to sell your home while in quarantine, self-isolating or worse yet, while someone in the house is sick, is not going to be in anyone’s best interest. We know many people are postponing their plans to list their home for the time being. As I mentioned earlier, if you find yourself in a situation where you need to buy or sell then rest assured Yogi and I are ready to help and have the tools in place to market, show and sell your home. The number of sales is keeping pace with the new listing inventory so there are still buyers out there looking to buy. We are doing everything we can to keep everyone safe during this time.
Historical Sales By Property Type

Months Supply of Homes for Sale

Historical Median Sales Price – By Property Type

Historical Average Sales Price – By Property Type

Historical Sales – By Price Range


If you have any questions or concerns at all, give me a call or text at 519-497-4646 or shoot me an email to kevinbaker@kwhometeam.ca . Stay healty and stay safe!
Have a great weekend
Kevin
Strong Home Sales Continue here in Kitchener, Waterloo and Cambridge
Hope you had a wonderful Halloween and here is hoping the snow stays away for a little while longer. I wanted to shoot you a quick update on how the real estate market did in November here in Waterloo Region.
There were 538 residential properties sold here in Kitchener-Waterloo in October, an increase of 4.1 per cent compared to the same month last year.
Home sales in October included 334 detached (up 11.3 per cent), and 65 condominium apartments (up 1.6 per cent). Sales also included 108 townhouses (down 6.1 per cent) and 31 semi-detached homes (down 18.4 per cent).
The average sale price of all residential properties sold in October increased by 9.1 per cent to $533,288 compared to October 2018. Detached homes sold for an average price of $610,840 (an increase of 6.2 per cent compared to October of last year. During this same period, the average sale price for an apartment-style condominium was $333,895 for an increase of 6.7 per cent. Townhomes and semis sold for an average of $434,035 (up 11.2 per cent) and $461,590 (up 14.3 per cent) respectively.
The median price of all residential properties sold last month increased 12.4 per cent to $500,000 and the median price of a detached home during the same period increased by 8.3 per cent to $568,950.
The average days it took to sell a home in October was 22 days, which is three days fewer than it took in October 2018.
There were 670 residential properties listed in K-W and area last month, a decrease of 12.4 per cent compared to October of 2018, and a decrease of 3.3 per cent in comparison to the previous ten-year average for the month of October. The total number of homes available for sale in active status at the end of October totalled 691, a decrease of 26.5 per cent compared to October of last year, and well below the previous ten-year average of 1,412 listings for October. Months Supply of Homes for sale stood at 1.4 months in October, which is 26.3 percent lower than the same period last year. The previous ten-year average months supply of homes for October was 3.03.
Seasonal strength in October is common as people to look to make moves before Winter. With a scarcity of listings, buyers continue to snap up properties in the Kitchener-Waterloo area at a fast pace.
Here are some charts….
Historical Sales by Property Type

Months Supply of Homes for Sale
Historical Median Sales Price – By Property Type
Average Sales Price – By Property Type
Historical Sales – By Price Range

If you have any questions or have been thinking of making a move this fall, give me a call or text at 519-497-4646 or shoot me an email to kevinbaker@kwhometeam.ca and lets sit down, grab a coffee and plan out a strategy that is best suited for your families needs.
Have a great November!
Kevin
August Home Sales Ease as Prices Continue to Rise in Kitchener Waterloo.
Hope you had a wonderful weekend. Back to school is here and I am sure all the kids have settled in and got the new school year underway. August was another great month for Waterloo region real estate and here are the stats to keep you right up to date.
There were 459 residential properties sold through the MLS® in August, a decrease of 9.1 per cent compared to the same month last year.
Home sales in August included 267 detached (down 11.9 per cent), and 56 condominium apartments (down 13.8 per cent). Sales also included 97 townhouses (down 4.9 per cent) and 39 semi-detached homes (up 11.4 per cent).
The number of homes sold last month was below the average for August; however, we continue to see strong price gains across all property types.
The average sale price of all residential properties sold in August increased by 6.4 per cent to $524,482 compared to August 2018. Detached homes sold for an average price of $615,568 (an increase of 5.4 per cent compared to August of last year. During this same period, the average sale price for an apartment-style condominium was $324,778 for a decrease of 3.1 per cent. Townhomes and semis sold for an average of $420,239 (up 18.3 per cent) and $441,802 (up 10.2 per cent) respectively.
The median price of all residential properties sold last month increased 8.1 per cent to $495,000 and the median price of a detached home during the same period increased by 2.8 per cent to $560,000.
There were 574 residential properties in K-W and area last month, a decrease of 14.5 per cent compared to August of 2018, and a decrease of 13 per cent in comparison to the previous ten-year average for the month of August. The total number of homes available for sale in active status at the end of August totalled 734, a decrease of 17.3 per cent compared to August of last year, and well below the previous ten-year average of 1,426 listings for August. Months Supply of Homes for sale stood at 1.5 months in August, which is 16.7 percent lower than the same period last year.
The average days it took to sell a home in August was 26 days, which is two days fewer than it took in August 2018.
We’re noting differences in market balance depending on the price range, for homes priced under $600 thousand, it is still a strong seller’s market, whereas above $600 thousand, it is a more balanced situation.
One this to look at is the month’s supply of homes, also known as the absorption rate. For homes priced at more than $600,000, the months of supply stood at 3.4 in August, compared to 0.9 months for homes prices under that amount. Months supply is the inventory of homes for sale at the end of a given month, divided by the average monthly closed sales from the last 12 months. The previous ten-year average months supply across all price ranges has been just over 3 months.
It all comes down to what the buyers can find in their price range, homes in Kitchener-Waterloo are definitely in high demand, and there is strong competition among buyers trying to find one that will suit them.
Historical Sales by Property Type

Months Supply of Homes for Sale

Historical Median Sales Price – By Property Type
Historical Average Sales Price – By Property Type
Historical Sales – By Price Range

If you have any questions or have been thinking of making a move this summer or into the fall, give me a call or text at 519-497-4646 or shoot me an email to kevinbaker@kwhometeam.ca and lets sit down, grab a coffee and plan out a strategy that is best suited for your families needs.
Have a great September!
Kevin
Stronger home sales here in Kitchener Waterloo for October
Fall is here, and that brings with it leaves falling and the beautiful colors of the season. I hope you had a great Halloween with the kids and today i thought i would let you know how the Real Estate did market here in Waterloo region.
There were 514 homes sold through the Multiple Listing System (MLS® System) in October, an increase of 7.8 per cent compared to October of last year. On a year-to-date basis 5,070 residential units have sold compared to 5,822 during the same period in 2017, a decrease of 12.9 per cent. It was a stronger than average October for home sales and listing activity for sure. Gradually increasing interest rates could be nudging both buyers and sellers from the sidelines of the housing market in my opinion.
Residential sales in October included 297 detached (up 4.6 per cent compared to October 2017), and 128 condominium units (up 19.6 per cent) which includes any property regardless of style (i.e. semis, townhomes, apartment, detached etc.). Sales also included 36 semi-detached homes (down 18.2 per cent) and 47 freehold townhouses (up 23.7 per cent).
The average sale price of all residential properties sold in October increased 7.7 per cent to $489,725 compared to the same month a year ago. Detached homes sold for an average price of $576,731 an increase of 6.2 per cent compared to October of last year. During this same period, the average sale price for an apartment style condominium was $310,215 an increase of 24.1 per cent. Townhomes and semis sold for an average of $387,602 (up 10.9 per cent) and $403,750 (up 13.8 per cent) respectively.
The median price of all residential properties sold last month was up 6.5 per cent compared to October of last year at $444,500 and the median price of a detached home during the same period increased 8.5 per cent to $525,350. Not surprisingly we’re seeing the biggest surges in average price happening in the denser forms of housing such as condos. This is partly a reflection of demand being strongest in the entry-level price ranges as well as there being more newly constructed units in the mix.
New listings totaled 760 residential properties in K-W and area in last month, a 14 per cent increase compared to October of last year, and 12.7 per cent above the historical ten-year average of 674. The number of active residential listings at the end of October totaled 1,014, which is 21 per cent higher than October of last year but still 461 units fewer than the previous ten-year average of 1,475 listings for October.
If you have any questions or are thinking of buying or selling a property in the coming months, please give me a call at 519-497-4646 or email to kevinbaker@kwhometeam.ca and we can sit down, grab a coffee and discuss the best way to make it a smooth move for your family.
Enjoy your week!
Kevin
Home Sales are down but Prices are Up here is Kitchener Waterloo Region
The hot weather is here!! I hope you have been able to stay cool during our recent heat wave. The June stats are out and home sales in June were down but prices are up! Have a read through the stats to hear how the Residential Home market did here in Waterloo Region.
June home sales were down 12.8 per cent compared to last month and down 15.6 per cent compared to last year’s June which was the second highest on record. A total of 604 residential properties sold in June compared to 716 the same time last year. On a year-to-date basis there have been 3,096 home sales during the first half of the year, a decrease of 19.1 per cent. After two consecutive years of extraordinary activity where we saw home sales exceeding 700 units in June, some normality has returned to the market. The approximately 600 units that sold last month is in line with the ten-year average for June.
Residential sales in June included 365 detached (down 21.2 per cent compared to June 2017), and 151 condominium units (up 6.3 per cent) which includes any property regardless of style (i.e. semis, townhomes, apartment, detached etc.). Sales also included 38 semi-detached homes (down 29.6 per cent) and 43 freehold townhouses (down 15.7 per cent).
The average sale price of all residential properties sold in June increased 5.2 per cent to $489,584 compared to the same month a year ago. Detached homes sold for an average price of $575,003 an increase of 7 per cent compared to June of last year. During this same period, the average sale price for an apartment style condominium was $314,180, an increase of 13.2 per cent. Town homes and semis sold for an average of $378,562 (up 10.8 per cent) and $391,830 (up 2.9 per cent) respectively. The median price of all residential properties sold last month was up 5.9 per cent compared to June of last year at $450,000, and the median price of a detached home during the same period increased 9.5 per cent to $520,000. There were 850 residential properties listed in K-W and area last month, down 21.5 per cent compared to June of 2017, but fairly close to the historical (2007-2016) average of 859. The number of active residential listings on the MLS® System to the end of June totaled 1,030, which is 11 per cent higher than June of last year but still significantly below the historical (2007-2016) ten-year average of 1,728 listings for June.
This is a good time to sell as demand remains strong and very competitive within some price ranges. The mortgage stress-test is certainly impacting some buyers which has made some price ranges of homes even more competitive. Of course, this is also a great time to buy in Waterloo Region. I think we’ve been traditionally a little undervalued and even with the past two years of feverish activity, Waterloo Region remains an attractive area to live and homes here will remain a good investment over the long-haul. The average days it took to sell a home were up slightly in June to 22 days, compared to 16 days in June 2017.
If you are thinking of buying or selling please give me a call and we can sit down, grab a coffee and discuss what the best strategy is for you and your family in this current Real estate environment here in Waterloo Region. Feel free to call me at 519-497-4646 or email direct to kevinbaker@kwhometeam.ca
Enjoy your July!!
Kevin
