
Home Sales in Kitchener Waterloo come in Like a lion and out like a Lamb in March
Hope you have been staying safe during this unique time in all our lives. Rest assured Yogi and I are doing everthing we can to prevent the spread by staying home as much as posssible and limiting client interactions to phone calls, facetime, zoom meetings, etc. We are both here to help if you and your family need to make a move and we have the tools and systems in place for both buyers and sellers for proper marketing of our listings, getting buyers to view the properties, as well as ourselves to keep everyone safe.
I thought you would like an update on what is happening out there in the Waterloo Region Real Estate Market, so here are the stats for March.
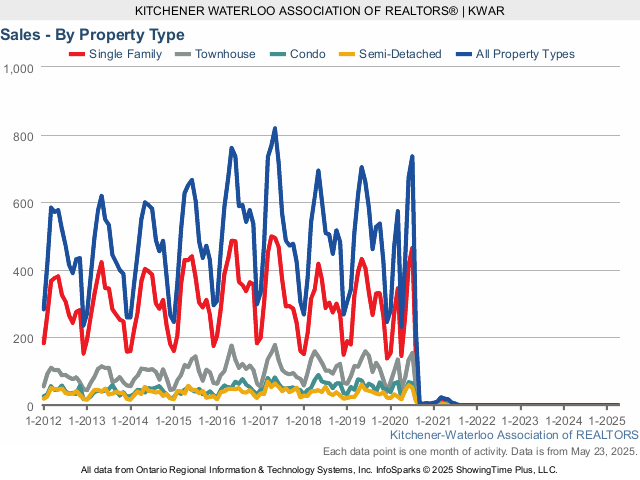
There were 577 residential homes sold in March, an increase of 13.1 per cent compared to the same month last year, and 0.2 per cent below the previous 5-year average.
During the first quarter of 2020, there were 1,327 home sales, 14.6 per cent above last year’s result for the same period and 4 per cent above the previous 5-year average.
Total residential sales in March included 348 detached homes (up 7.1 per cent), and 68 condominium apartments (up 5.1 per cent). Sales also included 136 townhouses (up 17.2 per cent) and 25 semi-detached homes (up 4.2 per cent).
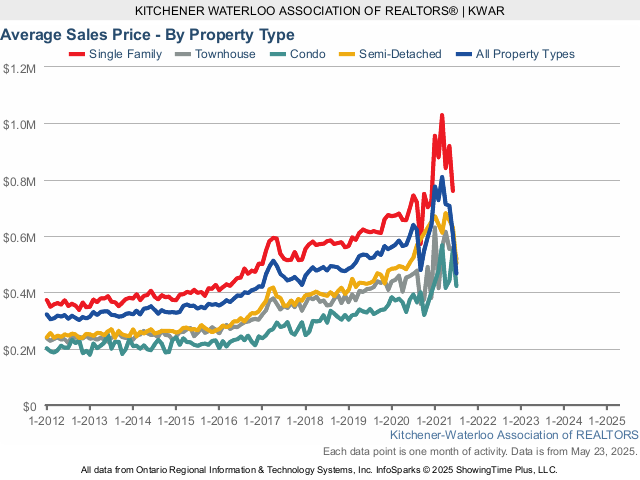
The average sale price of all residential properties sold in March increased 15.3 per cent to $583,752 compared to the same month last year, while detached homes sold for an average price of $679,728 an increase of 15.9 per cent. During this same period, the average sale price for an apartment-style condominium was $378,443 for an increase of 17.9 per cent. Townhomes and semis sold for an average of $457,547 (up 23 per cent) and $492,752 (up 17.4 per cent) respectively.
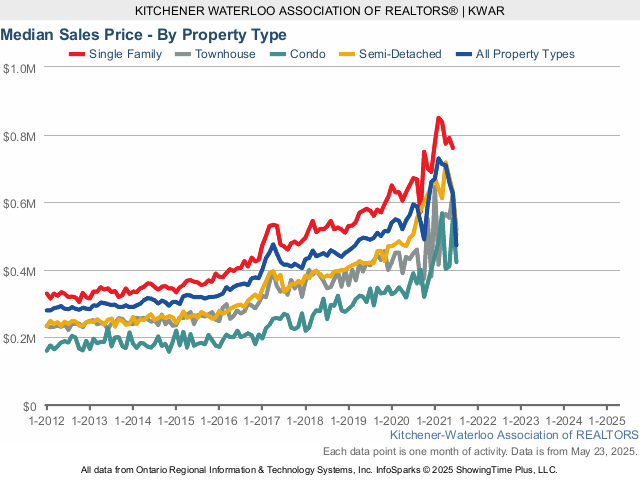
The median price of all residential properties sold in March increased 14.6 per cent to $544,500 and the median price of a detached home during the same period increased 16.2 per cent to $628,500.
Now of course is this not business as usual for us as Realtors or our clients. As people everywhere follow instructions to only leave their homes for essential reasons, this is impacting the number of showings, and how properties are shown.
There were a higher than average number of homes listed during the Month of March. There were 864 new listings added to the MLS® System in KW and area last month, an increase of 7.6 per cent compared to March of 2019, and the greatest number since 2015. The number of new residential listings was also 3.7 per cent higher than the previous ten-year average for March.
The total number of homes available for sale in active status at the end of March was 535, a decrease of 35.9 per cent compared to March of last year.
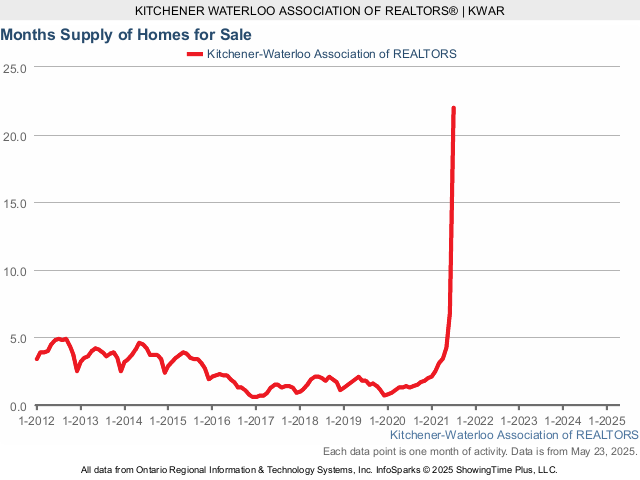
Despite the much-needed addition of new inventory coming to the market, the number of Months Supply (also known as absorption rate) continues to be very low at just 1.1 months for the month of March, 35.3 per cent below the same period last year. The previous ten-year average supply of homes for March was 2.73 months, and in the past 5 years, the average supply for March was 1.94 months.
There were also 51 listings last month that were suspended, which means the listing is temporarily “off-market,” and there can be no marketing, showings or offers during this period.
Trying to sell your home while in quarantine, self-isolating or worse yet, while someone in the house is sick, is not going to be in anyone’s best interest. We know many people are postponing their plans to list their home for the time being. As I mentioned earlier, if you find yourself in a situation where you need to buy or sell then rest assured Yogi and I are ready to help and have the tools in place to market, show and sell your home. The number of sales is keeping pace with the new listing inventory so there are still buyers out there looking to buy. We are doing everything we can to keep everyone safe during this time.
Historical Sales By Property Type

Months Supply of Homes for Sale

Historical Median Sales Price – By Property Type

Historical Average Sales Price – By Property Type

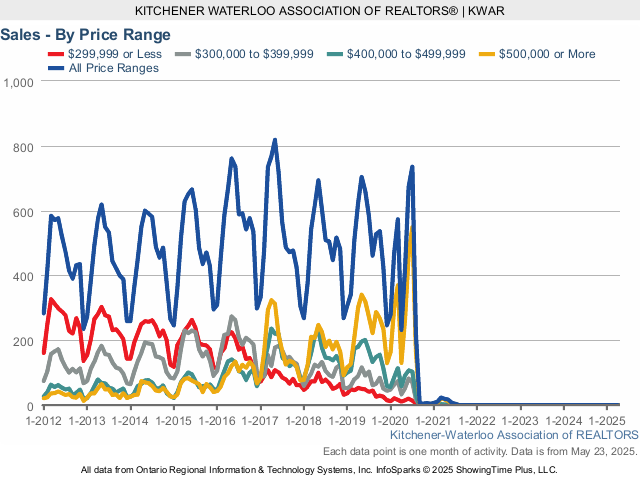
Historical Sales – By Price Range


If you have any questions or concerns at all, give me a call or text at 519-497-4646 or shoot me an email to kevinbaker@kwhometeam.ca . Stay healty and stay safe!
Have a great weekend
Kevin
Strong Home Sales Continue here in Kitchener, Waterloo and Cambridge
Hope you had a wonderful Halloween and here is hoping the snow stays away for a little while longer. I wanted to shoot you a quick update on how the real estate market did in November here in Waterloo Region.
There were 538 residential properties sold here in Kitchener-Waterloo in October, an increase of 4.1 per cent compared to the same month last year.
Home sales in October included 334 detached (up 11.3 per cent), and 65 condominium apartments (up 1.6 per cent). Sales also included 108 townhouses (down 6.1 per cent) and 31 semi-detached homes (down 18.4 per cent).
The average sale price of all residential properties sold in October increased by 9.1 per cent to $533,288 compared to October 2018. Detached homes sold for an average price of $610,840 (an increase of 6.2 per cent compared to October of last year. During this same period, the average sale price for an apartment-style condominium was $333,895 for an increase of 6.7 per cent. Townhomes and semis sold for an average of $434,035 (up 11.2 per cent) and $461,590 (up 14.3 per cent) respectively.
The median price of all residential properties sold last month increased 12.4 per cent to $500,000 and the median price of a detached home during the same period increased by 8.3 per cent to $568,950.
The average days it took to sell a home in October was 22 days, which is three days fewer than it took in October 2018.
There were 670 residential properties listed in K-W and area last month, a decrease of 12.4 per cent compared to October of 2018, and a decrease of 3.3 per cent in comparison to the previous ten-year average for the month of October. The total number of homes available for sale in active status at the end of October totalled 691, a decrease of 26.5 per cent compared to October of last year, and well below the previous ten-year average of 1,412 listings for October. Months Supply of Homes for sale stood at 1.4 months in October, which is 26.3 percent lower than the same period last year. The previous ten-year average months supply of homes for October was 3.03.
Seasonal strength in October is common as people to look to make moves before Winter. With a scarcity of listings, buyers continue to snap up properties in the Kitchener-Waterloo area at a fast pace.
Here are some charts….
Historical Sales by Property Type
Months Supply of Homes for Sale
Historical Median Sales Price – By Property Type
Average Sales Price – By Property Type
Historical Sales – By Price Range
If you have any questions or have been thinking of making a move this fall, give me a call or text at 519-497-4646 or shoot me an email to kevinbaker@kwhometeam.ca and lets sit down, grab a coffee and plan out a strategy that is best suited for your families needs.
Have a great November!
Kevin
Home sales had 2nd best November on record here in Kitchener Waterloo
Hope you are having a great week and all ready for the upcoming holiday season. I wanted to take a moment to bring you up to date on what is happening in the Kitchener Waterloo real estate market. November was a great month here in Waterloo region with the 2nd best home sales on record for November.
Last month a total of 483 residential properties sold in Kitchener-Waterloo and area through the MLS® system. Home sales were up 14.2 per cent in November compared to the same month last year, and up 19 per cent compared to the previous 10-year November average of 406 sales, making it the second-best November on record.
November’s sales included 265 detached (up 9.5 per cent compared to November 2017), and 152 condominium units (up 52 per cent) which includes any property regardless of style. Sales also included 27 semi-detached homes (down 46 per cent) and 31 freehold townhouses (up 14.8 per cent). For the second straight month we are reporting stronger than average sales, which is great to see. The prospect of further interest rate increases that were indicated last month could be responsible for the current surge in home sales.
The average sale price of all residential properties sold in November increased 7.6 per cent to $477,526 compared to the same month a year ago. Detached homes sold for an average price of $580,551 an increase of 12.8 per cent compared to November of last year. During this same period, the average sale price for an apartment style condominium was $305,334 an increase of 10 per cent. Townhomes and semis sold for an average of $361,177 (down 2 per cent) and $416,878 (up 10.7 per cent) respectively. The median price of all residential properties sold last month was up 6.3 per cent compared to November of last year at $443,800 and the median price of a detached home during the same period increased 9.5 per cent to $520,000.
Waterloo region continues to be a very desirable place for purchasing a home, and affordability is a concern in Waterloo Region as we continue to see prices increase, especially for detached homes. While we believe this is more a reflection of our region being “discovered” by buyers from the GTA, it is resulting in more entry-level clients pursuing condominiums and townhomes. Combined with an ongoing tight supply of listings buyers are facing continued upward pressure on sale prices in the region. There were 597 residential properties listed in K-W and area in last month, a 1.1 per cent decrease compared to November of last year, but 18.2 per cent above the historical ten-year average of 505. However, the number of active residential listings on the Kitchener Waterloo MLS® System to the end of November totalled 888, which is 12.8 per cent lower than November of last year and 449 units fewer than the previous ten-year average of 1,337 listings for November.
If you have any questions or are thinking of buying or selling in the coming months, please give me a call and we can sit down for a coffee and talk about some strategies that would work for your family needs. I also want to wish you and your family a wonderful holiday season and all the best for 2019.
Merry Christmas!
Kevin
Monthly Home Sales Up in August for first time in 2018 Here in Kitchener Waterloo
Back to school is here and so is the fall market. I hope you enjoyed your summer and continue to enjoy the great weather we are still having! August was a fantastic month in Waterloo Region real estate and here are the stats on how things went.
August home sales were down 0.8 per cent compared to last month and up 4.8 per cent compared to August of last year. A total of 505 residential properties sold in August compared to 482 the same time last year. For the first time this year we saw monthly home sales increase on a year-over-year basis. On a year-to-date basis, we’re still well below last year’s record-breaking number of home sales but still in line with historical averages.
Residential sales in August included 301 detached (up 5.2 per cent compared to August 2017), and 129 condominium units (up 25.2 per cent) which includes any property regardless of style (i.e. semis, townhomes, apartment, detached etc.). Sales also included 35 semi-detached homes (down 30 per cent) and 33 freehold townhouses (no change).
The average sale price of all residential properties sold in August increased 11.5 per cent to $493,358 compared to the same month a year ago. Detached homes sold for an average price of $583,564 an increase of 13 per cent compared to August of last year. During this same period, the average sale price for an apartment style condominium was $335,827 an increase of 14.1 per cent. Townhomes and semis sold for an average of $350,803 (up 4 per cent) and $401,011 (up 13.6 per cent) respectively. The median price of all residential properties sold last month was up 10.4 per cent compared to August of last year at $458,000, and the median price of a detached home during the same period increased 18.1 per cent to $543,450.
REALTORS® listed 670 residential properties in K-W and area last month, up 12.7 per cent compared to August of 2017, and 3.4% above the historical (2007-2016) average of 648. The number of active listings to the end of August totaled 917, which is 11.5 per cent higher than August of last year but still significantly below the historical (2007-2016) ten-year average of 1,550 listings for August.
More homes selling in the higher prices ranges in August were at least partly responsible for the increase in the average sale price, but strong demand on the buying side combined with low inventory on the listing side is continuing to keep upward pressure on prices.I certainly don’t see interest in Waterloo region as a place to live and work slowing down anytime soon, so we could definitely stand to see some more housing supply hit the market to meet buyer demand. The average days it took to sell a home in August was 28 days, compared to 26 days in August 2017.
If you have any questions or are thinking of buying or selling a property in the coming months, please give me a call at 519-497-4646 or email to kevinbaker@kwhometeam.ca and we can sit down, grab a coffee and discuss the best way to make it a smooth move for your family.
Enjoy your weekend!
Kevin
Strong Home Sales in May for Kitchener Waterloo
Summer is here and I hope that you able to get out and enjoy the great weather that we have had the past month.
May was another strong month for home sales in the Waterloo region. Here are the stats for the month of May.
Last month home sales were up 12.5 per cent compared to last month and down 15.3 per cent compared to last year’s record-setting May. A total of 692 residential properties sold in May compared to 817 the same time last year. Although unit sales were down substantially compared to last year’s manic market, May was still a strong month of home buying and selling in Kitchener-Waterloo and area.
The ten-year average number of home sales in Kitchener-Waterloo and area for the month of May is 625. Residential sales in May included 414 detached (down 15.7 per cent compared to May 2017), and 169 condominium units (down 7.1 per cent). Sales also included 46 semi-detached homes (down 28.1 per cent) and 53 freehold townhouses (down 24.3 per cent).
The average sale price of all residential properties sold in May decreased 2.4 per cent to $482,873 compared to the same month a year ago. Detached homes sold for an average price of $572,206 a decrease of 3.4 per cent compared to May of last year. During this same period, the average sale price for an apartment style condominium was $301,052, an increase of 2.7 per cent. Townhomes and semis sold for an average of $365,715 (up 1.3 per cent) and $393,616 (up 2 per cent) respectively. The median price of all residential properties sold last month was down 0.9 per cent compared to May of last year at $445,000, and the median price of a detached home during the same period decreased 2.8 per cent to $520,000.
There were 1,068 residential properties listed in K-W and area last month, down 15.8 per cent compared to May of 2017, but up 14.4 per cent compared to the historical (2007-2016) average. The number of active residential listings at the end of May totaled 1,062, which is 27.9 per cent higher than May of last year but still significantly below the historical (2007-2016) ten-year average of 1,719 listings for May.
With interest rates expected to increase in July, we’re seeing strong demand for homes in Waterloo region. Sales are strongest in the four to five hundred thousand price range, and while we’re certainly seeing activity cool from the past two years, once you eliminate those you quickly realize that sales volume and prices remain ahead of the ten-year averages. The average days it took to sell a home in May was 20 days, compared to 11 days in May 2017.
If you have any questions or are thinking of buying or selling a property in the coming months, please give me a call at 519-497-4646 or email to kevinbaker@kwhometeam.ca and we can grab a coffee and discuss the best way to make it a smooth move for your family.
Have a great June!
Kevin
Kitchener Waterloo Real Estate Update for February 2018
Hope you are enjoying the great weather we have been having in the past few weeks. Spring is just around the corner and I can’t wait to get out there and enjoy the warm weather again.
Here are the stats on how the Kitchener Waterloo market did in the month of February. There were 377 residential properties sold through MLS® in February which was an increase of 40 per cent compared to last month and a decrease of 20.5 per cent compared to home sales a year ago. When we consider market activity we have to acknowledge that sales from the previous year or two were abnormally high. If you compare last February against the ten year average of sales, it was a pretty typical February.
Residential sales in February included 212 detached (down 29.3 per cent), and 118 condominium units (up 11.3 per cent) which includes any property regardless of style (i.e. semis, townhomes, apartment, detached etc.). Sales also included 25 semi-detached homes (down 21.9 per cent) and 17 freehold townhouses (down 45.2 per cent).
The average sale price of all residential properties sold in February increased 3.1 per cent to $478,801 compared to February 2017. Detached homes sold for an average price of $577,609 an increase of 5 per cent compared to February of last year. During this same period, the average sale price for an apartment style condominium was $265,144 for an increase of 6.8 per cent. Townhomes and semis sold for an average of $386,515 (up 14.1 per cent) and $391,628 (up 6 per cent) respectively. The median price of all residential properties sold last month was practically on par with February of last year at $436,143, and the median price of a detached home during the same period increased 4.8 per cent to $524,000.
The market has certainly cooled from this time last year, which is to be expected with the government’s efforts to make home ownership more difficult for home buyers. Realtors listed 551 residential properties in K-W and area last month, an increase of 0.5 per cent compared to February of 2017. The number of active residential listings on the MLS® System to the end of February totaled 667, which is 61.5 per cent more than February of last year, but still significantly below the previous ten year average of 1445 listings for February.
Months of inventory continues to track at a low 2 months. The average days it took to sell a home in February was 22 days, compared to 18 days in February 2017. We still have some homes that are selling in short order and with multiple offers, but others are taking longer and multiple offers are no longer the rule. Sellers need to adjust their expectation in this evolving market and in order to sell quickly they must be priced and marketed appropriately. While listing inventory is increasing, this is a slow process and we expect home inventory to remain low for at least the remainder of the year.
If you are thinking of buying or selling a home this year its important to have a solid strategy moving forward. Give me a call and we can grab a coffee and sit down and discuss the best options for you and your families needs.
Have a great March!
Kevin
January Home Sales Snowed Under in Kitchener Waterloo
A Big Year For Kitchener Waterloo Home Sales in 2017
Happy New Year!
It was a Huge year for Home Sales in 2017 here in Kitchener Waterloo with total residential sales volume surpasses 3 billion. There were 6,549 homes sold in Kitchener-Waterloo and area last year through the Multiple Listing System (MLS® System), just one percent behind last year’s record smashing results.
The year ended strong with 301 home sales in December, which is a slight one per cent above December of 2016, and 13 per cent above the previous five year average.
There was a definite push by some buyers to purchase a home prior to the new mortgage stress test kicking in January of 2018. While we appreciate the intent of these additional
changes, ultimately they will make it harder for some consumers to purchase the home they want. Picking up on the momentum from 2016, the first half of 2017 was characterized by an unparalleled number of home sales. Then in the latter half of the year, on the heels of the Ontario government’s announcement of the Fair
Housing Plan, the pace of sales began to decrease while still remaining above the previous five year’s averages.
There is almost universal agreement that the introduction of the Ontario Fair Housing Plan, which included a tax on non-residents who purchase homes in the Greater Golden Horseshoe (GGH) did contribute to the decline in home sales in the last half of the year, however that was mostly due to the psychological impact it had on buyers and sellers in the marketplace. For Waterloo Region these impacts were not yet as acute as in other areas of the GGH, but we are certainly concerned that any additional restrictions will further impede consumer affordability for homes.
Total residential sales in 2017 included 4,005 detached (down 4.2 per cent), and 1,461 condominium units (down 2.9 per cent) which includes any property regardless of style (i.e. semis, townhomes, apartment, detached etc.). Sales also included 545 semi-detached homes (up 27.6 per cent) and 467 freehold townhouses (up 10.9 per cent).
The consumer demand we experienced in 2017 was certainly strong enough to have outnumbered 2016 home sales, however the continued tight supply of listings last year served to tamp down unit sales and drive up prices. While the number of homes that were put up for sale was in keeping with previous years, inventory tracked low all
year long as buyers continued to snap up properties at a terrific rate. The average days it took to sell a home in 2017 was 19 days, compared to 43 days if you were to average out the previous 10 years.
Dollar volume of all residential real estate sold last year increased 19.5 per cent to just over three billion ($3,061,739,723) compared with 2016, reflecting the strong price gains realized in 2017 and marking the first time sales have surpassed the three billion dollar milestone. The average sale price of all residential properties sold in 2017 increased 20.7 per cent to $467,513 compared to 2016. Detached homes sold for an average price of $549,046, an increase of 21.5 per cent compared to 2016. During this same period, the average sale price for an apartment style condominium was $271,940 for an increase of 18.3 per cent. Townhomes and semis sold for an average of $353,692 (up 23.6 per cent) and $378,275 (up 25.9 per cent) respectively.
The median price of all residential properties sold last year increased 21.1 per cent to $429,900, and the median price of a detached home during the same period increased 22 per cent to $495,000. With the continued influence of GTA buyers migrating to Waterloo region last year, 2017 was a great year if you were selling your home, but not so fun for those who were in the purchasing position. The quality of life enjoyed living in Waterloo Region has always been at the top compared to many other communities, even though our historical home prices have been relatively affordable. I think this secret is out now, and the activity of buyers from the GTA last year certainly demonstrates this.
While the frenzied buying activity has cooled under the multitude of newly-imposed government regulations, looking ahead we expect the demand to continue to be greater than the supply. While the balance is shifting, we do not believe there will be any decreases in property values and if anything, the correction for Waterloo Region was watching it increase. Of course, this will continue to put pressure on affordability for many would-be homebuyers.
The new stress test that just came into effect on January 1 is going to push some buyers out of the market and force others to purchase homes at a lower price point than they want as it reduces their ability to borrow.
If you have any questions on our local real estate market or if you are thinking of buying or selling a home or condo in 2018 please don’t hesitate to give me a call at 519-497-4646 or email to kevinbakerrealestate@gmail.com We can grab a coffee and discuss how I can help.
Have a fantastic 2018!
Kevin
Over 800 Homes Sales in May Sets Record For Kitchener Waterloo
I hope you and your family have been doing well and enjoying the wonderful weather we have been having over the past month!! Summer certainly seems to be here.
Well May was another record setting month here in Waterloo region. There were 816 Residential properties sold through the MLS® System in May, an increase of 8.2 per cent compared to May 2016, and a 6 per cent increase compared to the previous month. This is the second consecutive month unit sales have hit an all-time high.
Home sales in May included 493 detached homes (up 3.8 per cent compared to May 2016), 180 condominium units (up 7.8 per cent) which includes any property regardless of style (i.e. semis, townhomes, apartment, detached etc.). Sales also included 64 semi-detached homes (up 39.1 percent) and 70 freehold townhouses (up 22.8 per cent).
With the persistent buyer demand that we’ve been experiencing these past several months, it was great to see that spike in residential listings. It certainly helped to give buyers more choice. There were 1,271 residential properties listed in K-W and area last month, a 38.6 per cent increase compared to May of 2016, and a 29 per cent increase compared to the previous month. It’s the first time in two years that the number of new listings put on the market has exceeded the 1,000 unit mark. The five-year average for new listings in May is 989.
While more homes were listed in May, it continues to be a seller’s market in Waterloo region and across the Greater Golden Horseshoe (GGH) as inventories remain tight at near or less than one month of inventory.
The average sales price of all residential sales increased 31 per cent to $496,664 compared to May 2016. Detached homes sold for an average price of $594,047 an increase of 35.3 per cent, while the average sale price for an apartment style condominium was $293,158, an increase of 25.8 per cent. Townhomes and semis sold for an average of $361,198 (up 30 per cent) and $383,819 (up 29.3 per cent) respectively. Ongoing demand for homes in Waterloo region has resulted in a shorter sales cycle.
The average days on market in May was 12, compared to 24 days a year ago. On a month to month basis, it took two additional days on average from list to sale date in May compared to April.
Looking at the Fair Housing Plan that was announced by the Ontario government in April, we think it is still too soon to know if the measures will have the intended cooling effect on the market. For now, home sales are still booming, and prices are going strong. While we continued to see big year-over year price gains in May, the overall residential average price did dip 3 per cent compared to April. Keep in mind that one month does not make a trend but the spike in listings last month may have contributed to the flatter prices. Looking forward to the summer will help gauge where the market is headed going into the last half of this year.
If you have any questions or are thinking of buying or selling a home in the next few month feel free to give me a call at 519-497-4646 or email to baker_kevin@rogers.com and we can sit down and discuss some options that best suit your families needs.
Have a great June!
Kevin
