
A Solid Year in 2019 for Kitchener Waterloo Home Sales
Hope you had a wonderful Holiday season with your family! 2020 is here and if a new home is in the plans here are the stats from last year to help with your decision making process.
Sales dipped in December, while prices continue to escalate. There were 5,925 residential homes sold in 2019, an increase of 1.6 per cent compared to 2018. Contrasted to past years, 2019’s annual sales were 2.3 per cent below the previous 5-year average, and 3 per cent above the previous 10-year average.
On a monthly basis, sales dipped 9 percent compared to last year, with 244 home sales in the month of December.
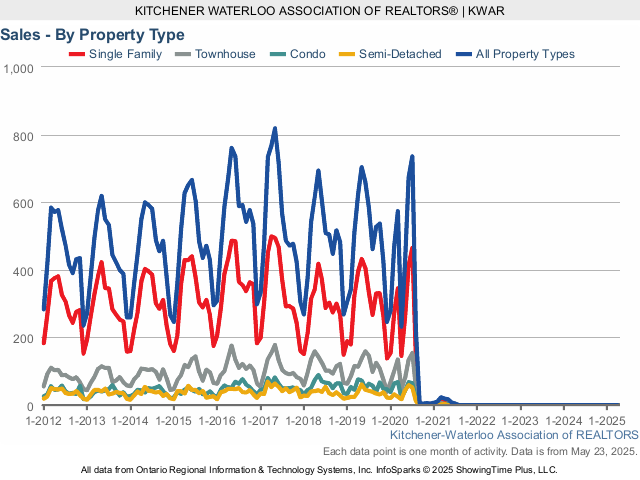
Total residential sales in 2019 included 3,590 detached (up 5.9 per cent), and 648 condominium units (down 7.8 per cent) which includes any property regardless of style (i.e. semis, townhomes, apartment, detached etc.). Sales also included 421 semi-detached homes (down 0.7 per cent) and 1,266 freehold townhouses (down 3.7 per cent).
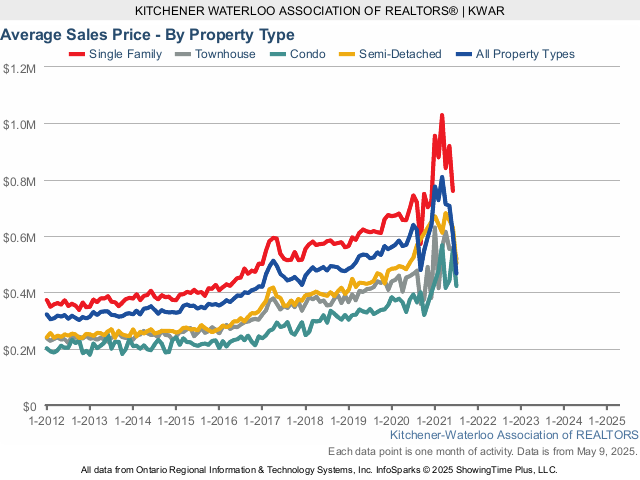
The average sale price of all residential properties sold in 2019 increased 9.3 per cent to $527,718 compared to 2018. Detached homes sold for an average price of $614,743 an increase of 7.1 per cent compared to 2018. During this same period, the average sale price for an apartment style condominium was 332,409 for an increase of 9.6 per cent. Townhomes and semis sold for an average of $409,979 (up 10 per cent) and $439,844 (up 11 per cent) respectively.
The median price of all residential properties sold last year increased 10.1 per cent to $490,000 and the median price of a detached home during the same period increased 8.6 per cent to $570,000.
In 2019, the lack of supply continued to be a hurdle for anyone who was trying to buy their first home, move-up from their current residence, or downsize. This ongoing state of the market caused further escalation of home prices in 2019. With interest rates expected to stay low in the year ahead combined with Waterloo region’s ongoing growth, I expect 2020 will see more price gains alongside a steady increase in sales.
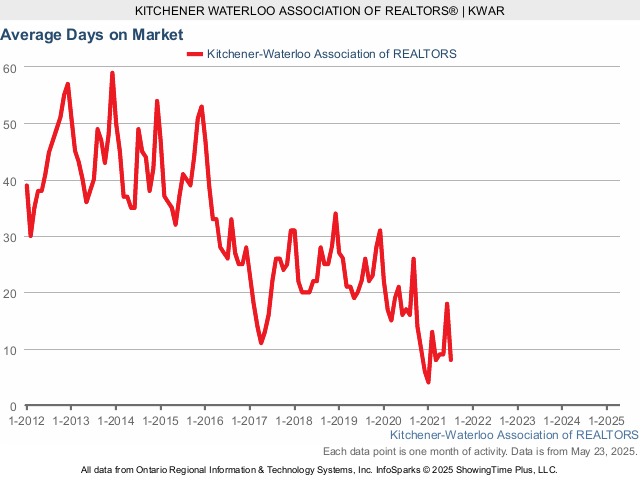
The number of months of inventory averaged 1.5 throughout the year, hitting its highest point in May when there was 2.1 months of supply, and ending the year at 0.7 (3-4 months supply is historically normal for Waterloo region). The average days to sell in 2019 was 23 days, compared to 24 days in 2018 and a previous 10-year average of 38 days.
Dollar volume of all residential real estate sold last year increased 10.9 per cent to $3.1 Billion compared with 2018.
While the majority of residential MLS® System activity is properties for sale, REALTORS® are increasingly representing landlords and tenants. Last year 733 residential leases occurred through KWAR’s MLS® System, which is on par with last year and, 2.5 times as many as just four years ago.
Historical Sales by Property Type
Months Supply of Homes for Sale

Historical Median Sales Price – By Property Type

Average Sales Price – By Property Type
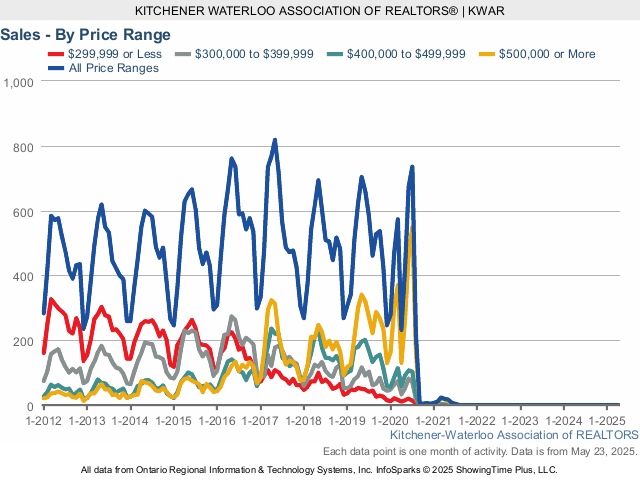
Historical Sales – By Price Range
If you have any questions or have been thinking of making a move this spring, give me a call or text at 519-497-4646 or shoot me an email to kevinbaker@kwhometeam.ca and lets sit down, grab a coffee and plan out a strategy that is best suited for your families needs.
Have a great January!
Kevin

Leave a comment