
Real Estate Sales Down in October here in Waterloo Region
I hope you are having a wonderful weekend. Looks like we have snow in the region today but hopefully it doesn’t stay too long. I am sure we will be hearing Christmas music on the radio soon enough.
The Real estate market stats are out for October and things seem to have taken a bump up in the first 2 weeks of October but that was short lived with the market slowing down again near the end of the month. Let’s take a look at the breakdowns.
There were 569 homes sold last month. This represents a 6.7 per cent decrease compared to the same period last year and a decline of 18.4 per cent compared to the average number of homes sold in the previous ten years for the same month.
While October home sales in Waterloo Region lag behind historical averages, activity did pick up compared to September. With more listings available than we typically see this time of year and borrowing costs beginning to ease, buyers have the opportunity to explore a wider range of options.
Total residential sales in October included 371 detached homes (down 3.4 per cent from October 2024), and 89 townhouses (down 16.8 per cent). Sales also included 56 condominium units (down 16.4 per cent) and 49 semi-detached homes (down 2.0 per cent).
In October, the average sale price for all residential properties in Waterloo Region was $734,928. This represents a 5.6 per cent decrease compared to October 2024 and a 2.4 per cent decrease compared to September 2025.
- The average sale price of a detached home was $842,907. This represents a 4.8 per cent decrease from October 2024 and a decrease of 1.6 per cent compared to September 2025.
- The average sale price for a townhouse was $593,652. This represents an 8.2 per cent decrease from October 2024 and a decrease of 2.2 per cent compared to September 2025.
- The average sale price for an apartment-style condominium was $433,746. This represents a 10.2 per cent decrease from October 2024 and a decrease of 1.9 per cent compared to September 2025.
- The average sale price for a semi was $573,332. This represents a decrease of 11.9 per cent compared to October 2024 and a decrease of 7.7 per cent compared to September 2025.

| MLS® Home Price Index Benchmark Price (HPI) | ||||||
| Kitchener-Waterloo | Cambridge | |||||
| Benchmark Type: | October 2025 | Monthly % Change | Yr./Yr. % Change | October 2025 | Monthly % Change | Yr./Yr. % Change |
| Composite | $664,300 | -1.3 | -6.9 | $690,000 | -1.6 | -6.5 |
| Single Family | $784,000 | -1.3 | -4.6 | $730,400 | -1.7 | -5.9 |
| Townhouse | $548,700 | 0.1 | -7.7 | $598,300 | -2.1 | -4.8 |
| Apartment | $394,200 | -3.0 | -10.3 | $448,900 | -0.9 | -6.5 |

The Bank of Canada’s recent 0.25% rate cut and its hint that rates may hold steady could give home buyers the confidence to get preapproved for a mortgage. With a good number of homes for sale in Waterloo Region, now is a good time to start looking for your next home in case we see a surge in activity into the new year.
There were 1,236 new listings added last month, an increase 7.2 per cent compared to October last year and a 28.7 per cent increase compared to the previous ten-year average for October.
The total number of homes available for sale in active status at the end of October was 2,056, an increase of 23.6 per cent compared to October of last year and 90.2 per cent above the previous ten-year average of 1,081 listings for October.
The total inventory across the market increased by 30.0 percent, resulting in a 3.9-month supply of all property types by the end of October. Condominium apartments had the highest inventory, with 7.6 months’ supply, followed by townhouses with 4.7 months’ supply and detached homes with 3.1 months’ supply. The number of months of inventory represents the time it would take to sell all current inventories at the current sales rate.
The average time to sell a home in October was 31 days, one day less than the previous month. In October 2024, it took 27 days for a home to sell, and the five-year average was 19 days.
Average Sales Price – Municipality

Average Sales Price – Township
Monthly Sales By Property Type

Monthly Supply of Homes for Sale

Monthly Supply of Homes for Sale – By Property Type

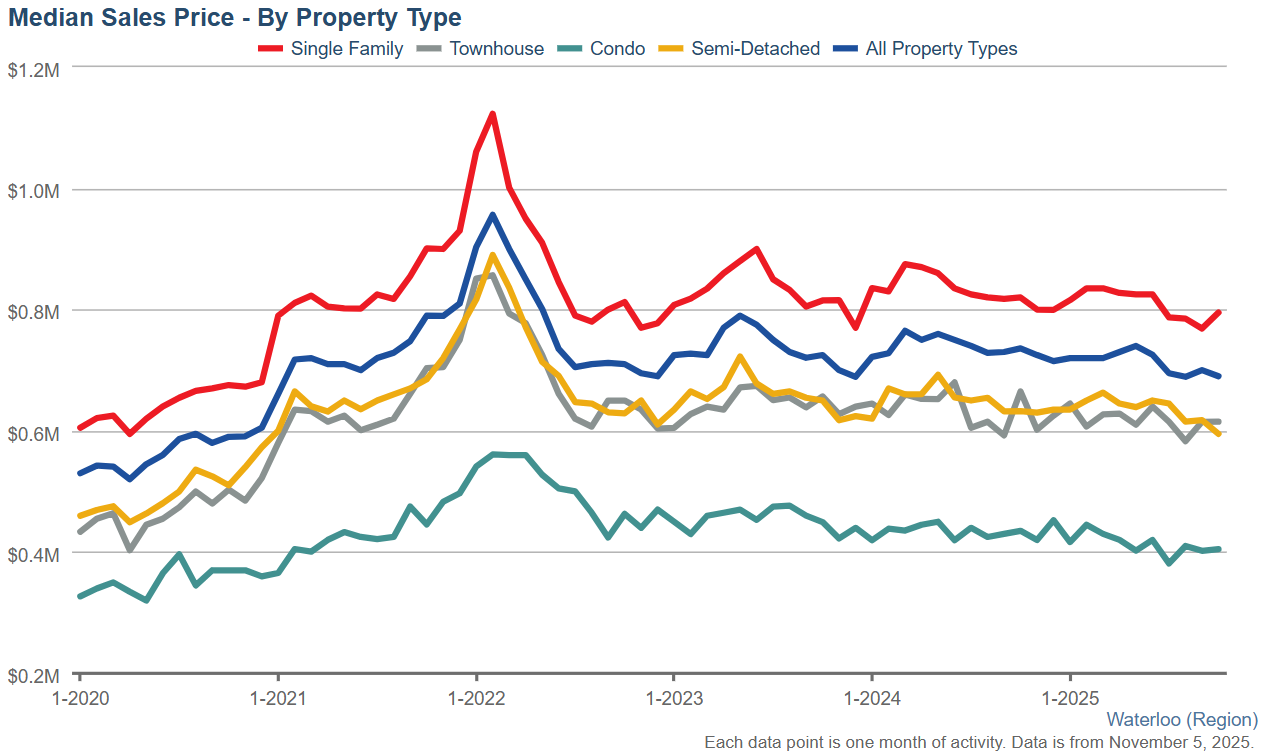
Monthly Median Sales Price – By Property Type
Monthly Average Sales Price – By Property Type

Monthly Average Days on Market

If you have any questions at all, are thinking of making a move this winter or are wondering what your home might be worth, give me a call or text to 519-497-4646 or shoot me an email to kevinbakerrealestate@gmail.com and we can sit down for a coffee and chat about your family’s needs going forward.
Have a great week!
Kevin
Waterloo Region Housing Market Stays Balanced in September
I hope you had a wonderful weekend. We have been having some great weather so far this fall and I hope it continues.
The stats are out for September and things seem to be pretty balanced. We did see an uptick in activity in the past month so fingers crossed that it continues into the rest of fall. Let’s take a look at the stats…
In September, a total of 502 homes were sold. This represents a 4.7 per cent decrease compared to the same period last year and a decline of 25.0 per cent compared to the average number of homes sold in the previous ten years for the same month.
The September housing market continues to reflect broader economic conditions, with sales remaining below both last year’s levels and the ten-year average. While sales volumes have moderated from last year, this shift has created a more balanced market where buyers can take time with their decisions. Well-priced properties continue to attract attention, while homes that are priced above market value seem to be sitting on the market much longer than they should.
Total residential sales in September included 325 detached homes (down 4.1 per cent from September 2024), and 91 townhouses (down 5.2 per cent). Sales also included 51 condominium units (down 13.6 per cent) and 34 semi-detached homes (up 6.3 per cent).
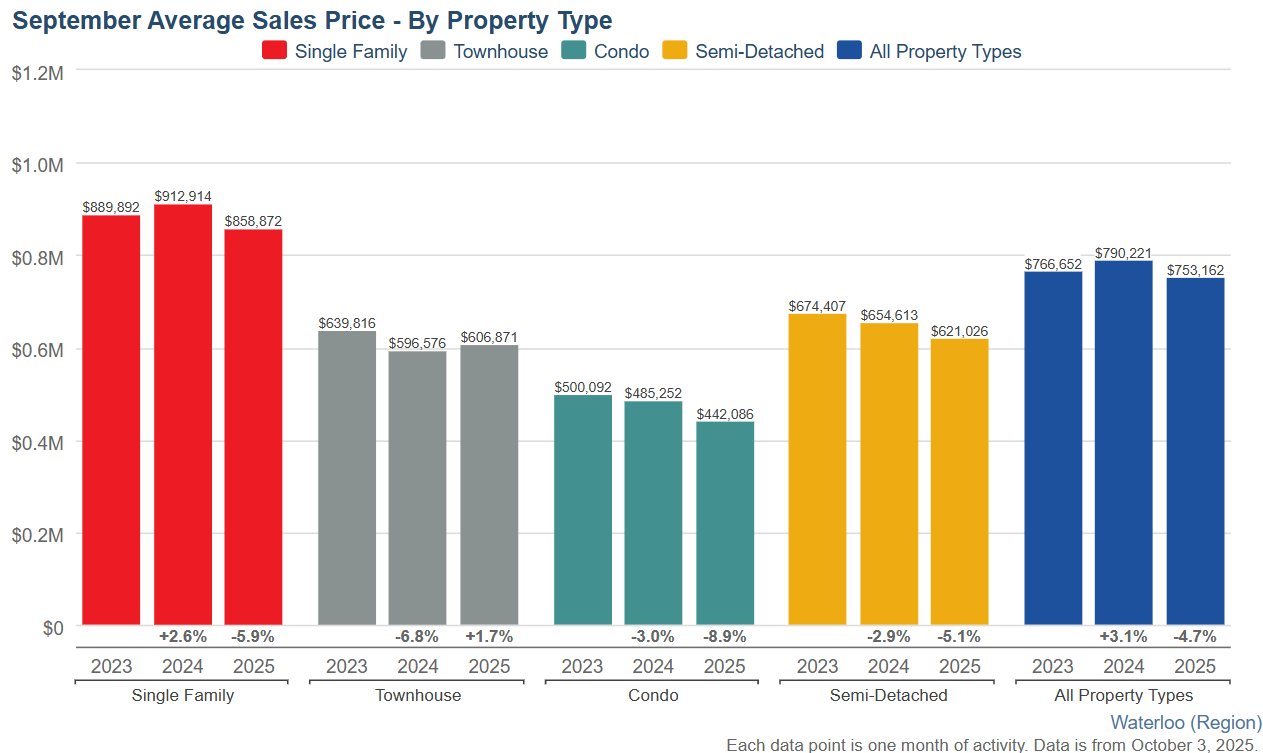
In September, the average sale price for all residential properties in Waterloo Region was $753,162. This represents a 4.7 per cent decrease compared to September 2024 and a 3.2 per cent increase compared to August 2025.
- The average sale price of a detached home was $858,872. This represents a 5.9 per cent decrease from September 2024 and an increase of 1.4 per cent compared to August 2025.
- The average sale price for a townhouse was $606,871. This represents a 1.7 per cent increase from September 2024 and an increase of 1.8 per cent compared to August 2025.
- The average sale price for an apartment-style condominium was $442,086. This represents a 8.9 per cent decrease from September 2024 and an increase of 2.0 per cent compared to August 2025.
- The average sale price for a semi was $621,026. This represents a decrease of 5.1 per cent compared to September 2024 and an increase of 0.5 per cent compared to August 2025.
| MLS® Home Price Index Benchmark Price (HPI) | ||||||
| Kitchener-Waterloo | Cambridge | |||||
| Benchmark Type: | September 2025 | Monthly % Change | Yr./Yr. % Change | September 2025 | Monthly % Change | Yr./Yr. % Change |
| Composite | $673,100 | -0.3 | -7.6 | $701,700 | 0.1 | -5.4 |
| Single Family | $794,600 | -0.1 | -5.9 | $742,700 | 0.1 | -4.5 |
| Townhouse | $548,300 | -1.3 | -9.0 | $611,500 | 0.3 | -4.7 |
| Apartment | $406,200 | -0.9 | -6.8 | $453,100 | -0.4 | -5.9 |

There were 1,469 new listings added last month, an increase 11.0 per cent compared to September last year and a 32.9 per cent increase compared to the previous ten-year average for September.
The total number of homes available for sale in active status at the end of September was 2,094, an increase of 22.2 per cent compared to September of last year and 79.5 per cent above the previous ten-year average of 1,167 listings for September.
The total inventory across the market increased by 29.0 percent, resulting in a 4.0-month supply of all property types by the end of September. Condominium apartments had the highest inventory, with 7.3 months’ supply, followed by townhouses with 4.8 months’ supply and detached homes with 3.3 months’ supply. The number of months of inventory represents the time it would take to sell all current inventories at the current sales rate.
The average time to sell a home in September was 32 days, which was the same in the previous month. In September 2024, it took 28 days for a home to sell, and the five-year average was 19 days.
Average Sales Price – Municipality

Average Sales Price – Township
Monthly Sales By Property Type

Monthly Supply of Homes for Sale

Monthly Supply of Homes for Sale – By Property Type

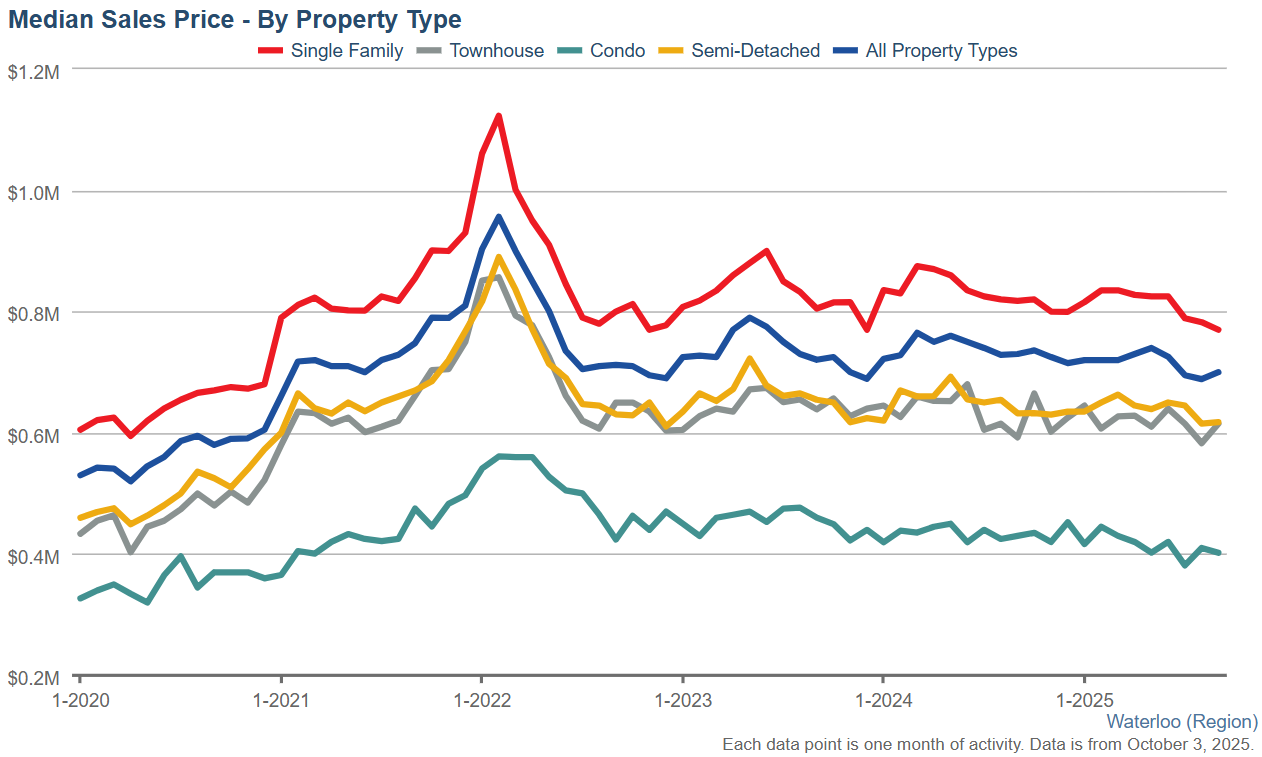
Monthly Median Sales Price – By Property Type
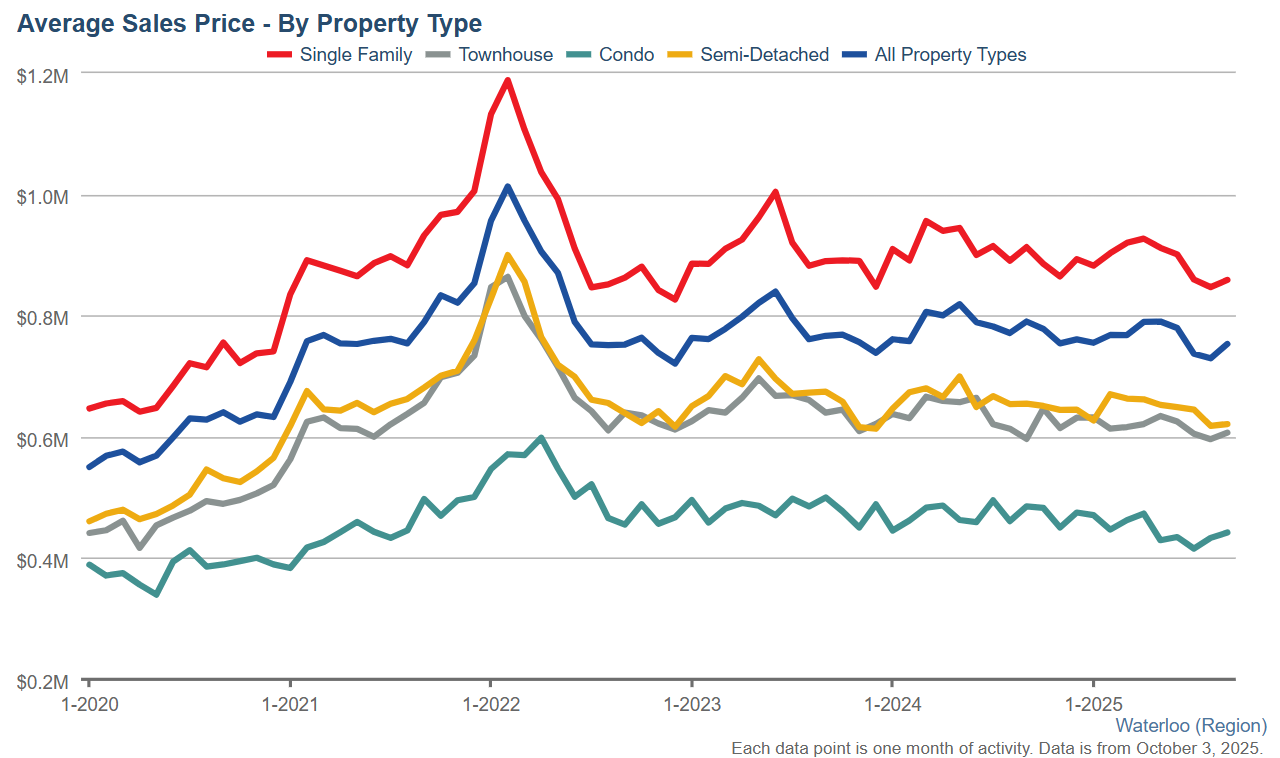
Monthly Average Sales Price – By Property Type
Monthly Average Days on Market

If you have any questions at all, are thinking of making a move this fall or are wondering what your home might be worth, give me a call or text to 519-497-4646 or shoot me an email to kevinbakerrealestate@gmail.com and we can sit down for a coffee and chat about your family’s needs going forward.
Have a great Thanksgiving next weekend with your families!
Kevin
Waterloo Region Housing Market Holds Steady in August
I hope you had a wonderful labour day long weekend. Now that the kids are back in school routines should return back to normal. Remember to drive carefully around school zones, as the little ones settle in again.
The stats are out for August, let’s take a look and see what the market is doing here in Waterloo Region.
In August, a total of 536 homes were sold. This is a decrease of 1.3 per cent compared with the same period last year and a decline of 23.1 per cent compared to the average number of homes sold in the previous ten years for the same month.
The market is showing signs of stabilization, though we’re seeing a continued cooling trend compared to last year. While sales volumes have only slightly decreased year-over-year, the more notable change is in pricing, with most property types experiencing moderate downward pressure.
Total residential sales in August included 320 detached homes (down 5.6 per cent from August 2024), and 101 townhouses (down 1.0 per cent). Sales also included 62 condominium units (up 1.6 per cent) and 50 semi-detached homes (up 25.0 per cent).
In August, the average sale price for all residential properties in Waterloo Region was $728,465. This represents a 5.5 per cent decrease compared to August 2024 and a 1.0 per cent decrease compared to July 2025.
- The average sale price of a detached home was $846,405. This represents a 4.6 per cent decrease from August 2024 and a decrease of 1.3 per cent compared to July 2025.
- The average sale price for a townhouse was $594,200. This represents a 3.2 percent decrease from August 2024 and a 1.7 percent decrease compared to July 2025.
- The average sale price for an apartment-style condominium was $433,113. This represents a 6.0 per cent decrease from August 2024 and an increase of 4.2 per cent compared to July 2025.
- The average sale price for a semi was $618,206. This represents a 5.5 per cent decrease from August 2024 and a 4.1 per cent decrease compared to July 2025.
| MLS® Home Price Index Benchmark Price (HPI) | ||||||
| Kitchener-Waterloo | Cambridge | |||||
| Benchmark Type: | August 2025 | Monthly % Change | Yr./Yr. % Change | August 2025 | Monthly % Change | Yr./Yr. % Change |
| Composite | $675,400 | -0.4 | -7.1 | $701,100 | -1.5 | -5.6 |
| Single Family | $795,400 | -0.1 | -5.2 | $742,100 | -1.7 | -4.4 |
| Townhouse | $555,400 | -1.3 | -8.5 | $609,600 | -0.2 | -6.6 |
| Apartment | $409,900 | -0.2 | -7.1 | $455,200 | -0.5 | -5.7 |

There were 1,028 new listings added last month, an increase of 3.0 per cent compared to August last year and a 11.0 per cent increase compared to the previous ten-year average for August.
The average time to sell a home in August was 32 days, which is the same as the previous month. In August 2024, it took 25 days for a home to sell, and the five-year average was 19 days.
Despite the softer market conditions, we are encouraged by the healthy increase in new listings, which gives buyers more options. While our local market statistics indicate signs of stabilization, we are operating in a complex economic environment. The Bank of Canada’s decision to maintain interest rates at 2.75% for the third consecutive time provides some predictability for both buyers and sellers. However, economic uncertainty and the Bank’s focus on inflation, especially regarding shelter costs, remind us that we are in a period where both buyers and sellers need to stay informed.
If you have any questions at all, are thinking of making a move this fall or are wondering what your home might be worth, give me a call or text to 519-497-4646 or shoot me an email to kevinbakerrealestate@gmail.com and we can sit down for a coffee and chat about your family’s needs going forward.
Have a great rest of September!
Kevin
Waterloo Region Housing stats showing a more balanced market in June
I hope you had a wonderful Canada Day! The weather lately has been great, a little hot for my liking but certainly a good reason to get outside and enjoy it.
The stats are out for June and things are looking more balanced in the Waterloo Region Real estate market. Let’s take a look…
In June, a total of 676 homes were sold. This represents a 0.3 per cent increase compared to the same period last year and a decline of 21.7 per cent compared to the average number of homes sold in the previous ten years for the same month.
While home sales in June were relatively stable year-over-year, we’re seeing a more balanced market emerge in Waterloo Region. What’s particularly notable is the increase in condominium sales – up over 34% – suggesting a lot of buyers are looking for more affordable housing options.. While more listings are coming to market, properties are taking a little longer to sell, giving buyers more time to make informed decisions during their home search.
Total residential sales in June included 442 detached homes (up 5.6 per cent from June 2024), and 113 townhouses (down 17.4 per cent). Sales also included 86 condominium units (up 34.4 per cent) and 35 semi-detached homes (down 25.4 per cent).
In June, the average sale price for all residential properties in Waterloo Region was $780,293. This represents a 1.1 per cent decrease compared to June 2024 and a 1.2 per cent decrease compared to May 2025.
- The average price of a detached home was $896,770. This represents a 0.2 per cent decrease from June 2024 and a decrease of 1.4 per cent compared to May 2025.
- The average sale price for a townhouse was $624,754. This represents a 6.0 percent decrease from June 2024 and a 1.6 percent decrease compared to May 2025.
- The average sale price for an apartment-style condominium was $435,435. This represents a 5.7 per cent decrease from June 2024 and an increase of 0.7 per cent compared to May 2025.
- The average sale price for a semi was $649,039, on par with June 2024 and a 0.5 per cent decrease compared to May 2025.
| MLS® Home Price Index Benchmark Price (HPI) | ||||||
| Kitchener-Waterloo | Cambridge | |||||
| Benchmark Type: | June 2025 | Monthly % Change | Yr./Yr. % Change | June 2025 | Monthly % Change | Yr./Yr. % Change |
| Composite | $686,100 | -2.3 | -7.5 | $723,400 | -1.5 | -4.2 |
| Single Family | $805,600 | -2.7 | -5.5 | $767,300 | -1.5 | -3.1 |
| Townhouse | $568,200 | -2.7 | -9.3 | $623,400 | -1.5 | -4.5 |
| Apartment | $417,900 | 1.5 | -8.3 | $458,200 | -0.8 | -6.6 |

There were 1,514 new listings added last month, an increase 5.3 per cent compared to June last year and a 15.1 percent increase compared to the previous ten-year average for June.
The average time to sell a home in June was 27 days, compared to 24 days in the previous month. In June 2024, it took 18 days for a home to sell, and the five-year average was 15 days.
If you have any questions at all, are thinking of making a move this summer or are wondering what your home might be worth, give me a call or text to 519-497-4646 or shoot me an email to kevinbakerrealestate@gmail.com and we can sit down for a coffee and chat about your family’s needs going forward.
Have a great rest of July!
Kevin
Inventory levels still growing and Sales are slowing here in Waetrloo Region
I hope you are having a great June so far. The nice weather is finally here and all the gardeners are loving it. The Real Estate Market here in Waterloo Region has been pretty sluggish over the past year and most notably this spring but I have noticed in the last week or two the showing activity has picked up on residential homes. The condo market is still saturated with inventory and not selling through well but prices seem to remain steady. Lets take a look at the stats for may….
In May, a total of 675 homes were sold, this represents a 9.3 per cent decrease compared to the same period last year and a decline of 26.2 per cent compared to the average number of homes sold in the previous ten years for the same month.
Total residential sales in May included 427 detached homes (down 8.4 per cent from May 2024), and 132 townhouses (down 1.5 per cent). Sales also included 67 condominium units (down 20.2 per cent) and 48 semi-detached homes (down 18.6 per cent).
In May, the average sale price for all residential properties in Waterloo Region was $789,154. This represents a 3.6 per cent decrease compared to May 2024 and a 0.8 per cent increase compared to April 2025.
- The average price of a detached home was $909,897. This represents a 3.7 percent decrease from May 2024 and a decrease of 1.0 per cent compared to April 2025.
- The average sale price for a townhouse was $634,320. This represents a 3.5 per cent decrease from May 2024 and an increase of 3.1 per cent compared to April 2025.
- The average sale price for an apartment-style condominium was $431,944. This represents a 6.7 percent decrease from May 2024 and a decrease of 9.4 per cent compared to April 2025.
- The average sale price for a semi was $652,627. This represents a decrease of 6.7 per cent compared to May 2024 and a decrease of 1.4 per cent compared to April 2025.
| MLS® Home Price Index Benchmark Price (HPI) | ||||||
| Kitchener-Waterloo | Cambridge | |||||
| Benchmark Type: | May 2025 | Monthly % Change | Yr./Yr. % Change | May 2025 | Monthly % Change | Yr./Yr. % Change |
| Composite | $702,400 | 0.6 | -6.6 | $734,300 | 1.0 | -3.4 |
| Single Family | $828,300 | 1.1 | -4.5 | $778,700 | 0.7 | -2.2 |
| Townhouse | $584,000 | -0.3 | -7.9 | $663,100 | 0.8 | -3.7 |
| Apartment | $411,600 | -6.7 | -10.2 | $462,100 | -2.0 | -6.8 |

Right now, we’re seeing a market that is different from the frenzied market of a few years ago, but that’s a good thing for buyers who have more breathing room to make decisions. The fundamentals that make Waterloo Region attractive – our diverse economy, strong tech sector, world-class educational institutes and stable governance – continue to strengthen. Waterloo Region has proven time and again that it is a solid place to invest and put down roots.
There were 1,663 new listings added last month, an increase 1.4 percent compared to May last year and a 15.6 percent increase compared to the previous ten-year average for May.
The average time to sell a home in May was 24 days, which was the same in the previous month. In May 2024, it took 16 days for a home to sell, and the five-year average was 14 days.
If you have any questions at all, are thinking of making a move this summer or are wondering what your home might be worth, give me a call or text to 519-497-4646 or shoot me an email to kevinbakerrealestate@gmail.com and we can sit down for a coffee and chat about your family’s needs going forward.
Have a great Fathers day next weekend to all the dads out there.
Kevin
The Real Estate Market is Shifting Here in Waterloo Region.
I hope you are having a great May so far. Looks like spring is hopefully here to stay, after this crazy winter and early spring weather we have been having. The numbers are out for Waterloo Region’s Real Estate market and we are certainly in a different environment than we have been used to for the past many years. Let’s break down the numbers and have a look….
In April, a total of 595 homes were sold in the Waterloo Region. This represents a 14.1 percent decrease compared to the same period last year and a decline of 26.7 percent compared to the average number of homes sold in the previous ten years for the same month.
Home sales in April showed typical seasonal improvement over March, but have remained notably below the ten-year average. What we’re seeing is a clear market rebalancing, with inventory levels up 75% above the ten-year average and nearly four months of supply across all property types. This shift is creating more opportunities for buyers who now have more time for due diligence and negotiations, while sellers are adapting to a market that demands strategic pricing and patience.
Total residential sales in April included 356 detached homes (down 12.5 per cent from April 2024), and 109 townhouses (down 19.9 per cent). Sales also included 71 condominium units (down 22.8 per cent) and 59 semi-detached homes (up 5.4 per cent).
In April, the average sale price for all residential properties in Waterloo Region was $789,639. This represents a 1.7 percent decrease compared to April 2024 and a 2.7 per cent increase compared to March 2025.
- The average price of a detached home was $927,591.?This represents a 1.7 percent decrease from April 2024 and an increase of 0.9 per cent compared to March 2025.
- The average sale price for a townhouse was $615,982. This represents a 7.0 percent decrease from April 2024 and a decrease of 0.2 per cent compared to March 2025.
- The average sale price for an apartment-style condominium was $473,079.?This is on par with April 2024 and an increase of 3.5 per cent compared to March 2025.
- The average sale price for a semi was $659,017. This represents a decrease of 0.7 per cent compared to April 2024 and a decrease of 0.6 per cent compared to March 2025.
Average Sale Price – Monthly

| MLS® Home Price Index Benchmark Price (HPI) | ||||||
| Kitchener-Waterloo | Cambridge | |||||
| Benchmark Type: | April 2025 | Monthly % Change | Yr./Yr. % Change | April 2025 | Monthly % Change | Yr./Yr. % Change |
| Composite | $703,500 | -3.5 | -6.1 | $730,400 | -1.4 | -3.4 |
| Single Family | $821,100 | -2.6 | -5.2 | $773,600 | -0.8 | -2.1 |
| Townhouse | $582,300 | -2.7 | -7.1 | $626,800 | -0.6 | -4.7 |
| Apartment | $441,200 | 1.6 | -3.2 | $471,800 | -2.3 | -6.4 |

There were 1,371 new listings added last month, a decrease of 4.9 percent compared to April last year and a 10.5 percent increase compared to the previous ten-year average for April.
The total number of homes available for sale in active status at the end of April was 1,936, an increase of 39.5 percent compared to April of last year and 75.3 percent above the previous ten-year average of 1,105 listings for April.
The total inventory across the market increased by 52.0 percent, resulting in a 3.8-month supply of all property types by the end of April. Condominium apartments had the highest inventory, with 8.0 months’ supply, followed by townhouses with 4.9 months’ supply and detached homes with 2.89 months’ supply. The number of months of inventory represents the time it would take to sell all current inventories at the current sales rate.
The average time to sell a home in April was 20 days, compared to 24 days in the previous month. In April 2024, it took 15 days for a home to sell, and the five-year average was 14 days.
Average Sales Price – Municipality

Average Sales Price – Township

Monthly Sales By Property Type

Monthly Supply of Homes for Sale

Monthly Supply of Homes for Sale – By Property Type

Monthly Median Sales Price – By Property Type

Monthly Average Sales Price – By Property Type

Monthly Average Days on Market

If you have any questions at all, are thinking of making a move this spring/summer or are wondering what your home might be worth, give me a call or text to 519-497-4646 or shoot me an email to kevinbakerrealestate@gmail.com and we can sit down for a coffee and chat about your family’s needs going forward.
Have a great Mother’s Day to all the mom’s out there.
Kevin
Home Sales Cool in March with inventory levels reaching 9 year highs
I hope you are having a great April so far. Looks like the spring is hopefully here after that crazy weather we had on wednesday and that means an increase in activity in the Kitchener Waterloo Real Estate Market. Let’s take a look at the stats from March
In March, a total of 459 homes were sold in the Waterloo Region. This represents a 23.1 percent decrease compared to the same period last year and a decline of 45.2 percent compared to the average number of homes sold in the previous ten years for the same month.
March’s housing market shows a significant shift from last year’s dynamics, with sales activity cooling while inventory levels have reached their highest point for March since 2015. This changing landscape is providing buyers with more options and time to make informed decisions.
Total residential sales in March included 259 detached homes (down 24.7 percent from March 2024), and 98 townhouses (down 24.0 per cent). Sales also included 60 condominium units (down 29.4 per cent) and 40 semi-detached homes (up 8.1 per cent).
In March, the average sale price for all residential properties in Waterloo Region was $771,915. This represents a 4.4 per cent decrease compared to March 2024 and a 0.5 per cent increase compared to February 2025.
- The average price of a detached home was $921,985. This represents a 3.6 percent decrease from March 2024 and an increase of 2.3 per cent compared to February 2025.
- The average sale price for a townhouse was $622,231. This represents a 6.6 percent decrease from March 2024 and an increase of 1.2 per cent compared to February 2025.
- The average sale price for an apartment-style condominium was $457,925. This represents a 5.5 percent decrease from March 2024 and an increase of 4.8 per cent compared to February 2025.
- The average sale price for a semi was $663,145. This represents a decrease of 2.5 per cent compared to March 2024 and a decrease of 1.1 per cent compared to February 2025.
Average Sale Price – Monthly

| MLS® Home Price Index Benchmark Price (HPI) | ||||||
| Kitchener-Waterloo | Cambridge | |||||
| Benchmark Type: | March 2025 | Monthly % Change | Yr./Yr. % Change | March 2025 | Monthly % Change | Yr./Yr. % Change |
| Composite | $728,800 | -0.2 | -2.7 | $740,900 | -1.4 | -1.9 |
| Single Family | $843,300 | 0.3 | -2.5 | $779,500 | -1.6 | -1.3 |
| Townhouse | $598,300 | -0.3 | -3.4 | $630,600 | 0.2 | -3.2 |
| Apartment | $434,200 | -1.4 | -6.7 | $482,800 | -0.3 | -3.5 |

While both average prices and the HPI declined on a year-over-year basis, we’re seeing month-over-month price stability in most housing categories. The increased inventory, now at a 3.2-month supply, is creating a more balanced market environment compared to the tight conditions we’ve experienced over the past many years. This shift is particularly evident in the condominium segment, where we now have nearly seven months of inventory available.
There were 1,180 new listings added last month, an increase of 15.5 per cent compared to March last year and a 2.4 per cent decrease compared to the previous ten-year average for March.
The total number of homes available for sale in active status at the end of March was 1,700, an increase of 58.4 per cent compared to March of last year and 72.9 per cent above the previous ten-year average of 983 listings for March.
The total inventory across the market increased by 68.4 percent, resulting in a 3.2-month supply of all property types by the end of March. Condominium apartments had the highest inventory, with 6.9 months’ supply, followed by townhouses with 4.2 months’ supply and detached homes with 2.3 months’ supply. The number of months of inventory represents the time it would take to sell all current inventories at the current sales rate.
The average time to sell a home in March was 28 days, compared to 24 days in the previous month. In March 2024, it took 19 days for a home to sell, and the five-year average was 14 days.
Average Sales Price – Municipality

Average Sales Price – Township

Monthly Sales By Property Type

Monthly Supply of Homes for Sale

Monthly Supply of Homes for Sale – By Property Type

Monthly Median Sales Price – By Property Type

Monthly Average Sales Price – By Property Type

Monthly Average Days on Market

If you have any questions at all, are thinking of making a move this spring or are wondering what your home might be worth, give me a call or text to 519-497-4646 or shoot me an email to kevinbakerrealestate@gmail.com and we can sit down for a coffee and chat about your family’s needs going forward.
Have a great rest of your weekend!
Kevin
New Listings up, sales down but prices remain stable in Waterloo Region
I hope you are having a great March so far. Looks like the spring thaw is fast approaching and that means an increase in activity in the Kitchener Waterloo Real Estate Market. Let’s take a look at the stats from February….
In February, a total of 363 homes were sold. This represents a 26.1 percent decrease compared to the same period last year and a decline of 38.8 percent compared to the average number of homes sold in the previous ten years for the same month.
While February’s home sales were affected by concerns over tariffs and their potential impact on employment, the market showed some encouraging signs. We saw a steady increase in new listings while prices remained stable. The month’s significant snowfall created practical challenges for buyers and sellers, affecting property viewings and transactions. However, I am seeing positive indicators in the market, with consistent attendance at open houses, pre-listing appointments, steady mortgage pre-approvals, and buyers on the sidelines carefully watching for the right opportunity to make their move.
Total residential sales in February included 221 detached homes (down 21.9 percent from February 2024), and 71 townhouses (down 36.0 percent). Sales also included 47 condominium units (down 35.6 percent) and 23 semi-detached homes (down 4.2 percent).
In February, the average sale price for all residential properties in Waterloo Region was $767,800. This represents a 1.3 percent increase compared to February 2024 and a 1.8 per cent increase compared to January 2025.
- The average price of a detached home was $900,003. This represents a 1.0 per cent increase from February 2024 and an increase of 2.1 per cent compared to January 2025.
- The average sale price for a townhouse was $613,924. This represents a 2.7 percent decrease from February 2024 and a decrease of 2.6 per cent compared to January 2025.
- The average sale price for an apartment-style condominium was $437,000. This represents a 5.8 percent decrease from February 2024 and a decrease of 7.2 per cent compared to January 2025.
- The average sale price for a semi was $670,352. This represents a decrease of 0.5 percent compared to February 2024 and an increase of 6.6 percent compared to January 2025.
Average Sale Price – Monthly

| MLS® Home Price Index Benchmark Price | ||||||
| Kitchener-Waterloo | Cambridge | |||||
| Benchmark Type: | February 2025 | Monthly % Change | Yr./Yr. % Change | February 2025 | Monthly % Change | Yr./Yr. % Change |
| Composite | $729,900 | 0.0 | -0.9 | $751,300 | 0.6 | 0.6 |
| Single Family | $841,000 | -0.8 | -1.1 | $792,100 | 0.6 | 1.6 |
| Townhouse | $600,200 | 1.7 | -1.8 | $629,300 | 0.5 | -2.1 |
| Apartment | $440,400 | 2.3 | -1.9 | $484,500 | 1.1 | -2.2 |

As we navigate these shifting dynamics in the Waterloo Region housing market, it’s important to remember that while sales may be down, the increase in inventory reflects growing opportunities for buyers. Now is a great time for buyers to get out and start looking for a new home.
There were 858 new listings added last month, an increase of 7.3 percent compared to February last year and a 0.8 percent increase compared to the previous ten-year average for February.
The total number of homes available for sale in active status at the end of February was 1,450, an increase of 55.7 percent compared to February of last year and 68.7 percent above the previous ten-year average of 860 listings for February.
The total inventory across the market increased by 52.9 percent, resulting in a 2.6-month supply of all property types by the end of February. Condominium apartments had the highest inventory, with 5.9 months’ supply, followed by townhouses with 3.6 months’ supply and detached homes with 1.8 months’ supply. The number of months of inventory represents the time it would take to sell off current inventories at the current sales rate.
The average time to sell a home in February was 24 days, compared to 34 days in the previous month. Likewise, in February 2024, it took 24 days for a home to sell, and the five-year average was 15 days.
If you have any questions at all, are thinking of making a move this spring or are wondering what your home might be worth, give me a call or text to 519-497-4646 or shoot me an email to kevinbakerrealestate@gmail.com and we can sit down for a coffee and chat about your family’s needs going forward.
Have a great rest of your week!
Kevin
Average Sales Price – Municipality

Average Sales Price – Township

Monthly Sales By Property Type

Monthly Supply of Homes for Sale

Monthly Supply of Homes for Sale – By Property Type

Monthly Median Sales Price – By Property Type

Monthly Average Sales Price – By Property Type

Monthly Average Days on Market

January 2025 Real Estate update for Kitchener, Waterloo and Cambridge
I hope you are having a great winter so far. The weather sure has been cold so hopefully you have been able to get out and enjoy some skiing or even a trip down south to enjoy some warmer weather.
The stats are out for January and things are remaining steady in the Waterloo Region Real Estate market. Listings are up, sales and prices are down slightly, so that is giving the buyers who are out there plenty of choice when looking for their next home. Let’s take a look at the numbers…
In January, a total of 329 homes were sold in the Waterloo Region. This represents a 12.0 per cent decrease compared to the same period last year and a decline of 18.6 per cent compared to the average number of homes sold in the previous ten years for the same month.
The Waterloo Region’s housing market shows promising dynamics as we begin 2025. With nearly 50 percent more active listings compared to last January and inventory levels well above the ten-year average, we’re seeing more choices for buyers in the market. While sales have softened compared to last year, the increased inventory levels are creating more balanced conditions between buyers and sellers.
Total residential sales in January included 188 detached homes (down 10.5 per cent from January 2024), and 81 townhouses (down 8.0 per cent). Sales also included 39 condominium units (down 30.4 per cent) and 21 semi-detached homes (up 5.0 per cent).
In January, the average sale price for all residential properties in Waterloo Region was $755,859. This represents a 1.0 per cent decrease compared to January 2024 and a 0.6 per cent decrease compared to December 2024.
- The average price of a detached home was $882,941. This represents a 3.1 per cent decrease from January 2024 and a decrease of 1.2 per cent compared to December 2024.
- The average sale price for a townhouse was $630,116. This represents a 1.1 per cent decrease from January 2024 and an increase of 0.1 per cent compared to December 2024.
- The average sale price for an apartment-style condominium was $469,623. This represents a 4.6 per cent increase from January 2024 and a decrease of 1.2 per cent compared to December 2024.
- The average sale price for a semi was $634,762. This represents a decrease of 1.9 per cent compared to January 2024 and a decrease of 1.6 per cent compared to December 2024.
Average Sale Price – Monthly

| MLS® Home Price Index Benchmark Price | ||||||
| Kitchener-Waterloo | Cambridge | |||||
| Benchmark Type: | January 2025 | Monthly % Change | Yr./Yr. % Change | January 2025 | Monthly % Change | Yr./Yr. % Change |
| Composite | $730,000 | 1.8 | 0.6 | $747,300 | 3.1 | 0.0 |
| Single Family | $847,500 | 3.1 | 1.5 | $787,400 | 3.8 | 1.2 |
| Townhouse | $590,100 | -1.5 | -2.0 | $626,400 | -0.6 | -3.9 |
| Apartment | $430,600 | -3.4 | -4.2 | $479,600 | 0.2 | -2.3 |

In an expected move, the Bank of Canada lowered its policy rate by 25 basis points to 3 per cent on January 29, 2025, helping to bring down the cost of borrowing. This reduction was welcome news for potential homebuyers, however, with a potential trade war with the U.S. still looming, it’s difficult to predict what will happen when the Bank makes its next interest rate announcement on March 12.
While the current economic uncertainty might make some house hunters hesitant, with the new mortgage reforms that took effect in December. These changes make it easier to qualify for a mortgage with a down payment of less than 20 percent. Additionally, the insured mortgage cap increased from $1 million to $1.5 million, and all first-time buyers and those purchasing new builds will be eligible for 30-year amortizations, which will help reduce monthly payments.
There were 901 new listings added in Waterloo Region last month, an increase of 25.0 per cent compared to January last year and a 27.6 per cent increase compared to the previous ten-year average for January.
The total number of homes available for sale in active status at the end of January was 1,296 an increase of 49.5 per cent compared to January of last year and 71.5 per cent above the previous ten-year average of 992 listings for January.
The total inventory across the market increased by 43.8 percent, resulting in a 2.3-month supply of all property types by the end of January. Condominium apartments had the highest inventory, with 5.1 months’ supply, followed by townhouses with 3.5 months’ supply and detached homes with 1.5 months’ supply. The number of months of inventory represents the time it would take to sell off current inventories at the current sales rate.
The average time to sell a home in January was 33 days, compared to 37 days in the previous month. In January 2024, it took 32 days for a home to sell, and the five-year average was 21 days.
If you have any questions at all, are thinking of making a move this spring or are wondering what your home might be worth, give me a call or text to 519-497-4646 or shoot me an email to kevinbakerrealestate@gmail.com and we can sit down for a coffee and chat about your family’s needs going forward.
Have a great rest of your week!
Kevin
Average Sales Price – Municipality

Average Sales Price – Township

Monthly Sales By Property Type

Monthly Supply of Homes for Sale

Monthly Supply of Homes for Sale – By Property Type

Monthly Median Sales Price – By Property Type

Monthly Average Sales Price – By Property Type

Monthly Average Days on Market

Waterloo Home Sales Show Slight Growth in 2024
Happy New Year! I hope you had a wonderful holiday season with your families and 2025 is off to a great start! With the arrival of snow, it looks like winter is finally here.
The stats are out for 2024 and it was a decent year for real estate sales here in Waterloo Region.
There were 6,777 homes sold in 2024, an increase of 2.8 per cent compared to 2023, and a decline of 18.9 per cent compared to the previous 5-year average for annual sales.
On a monthly basis, 334 homes were sold in December, an increase of 14.4 per cent compared to December 2023 and 9.9 per cent below the previous 5-year average for the month.
Although the number of homes sold in 2024 was still well below long-term averages, the final three months of the year showed a significant increase in sales. This increase coincided with lower interest rates, which heightened buyer interest and activity in the market.
For 2024, total residential sales included 4,100 detached (up 5.5 per cent), and 1,368 townhouses (up 2.6 per cent). Sales also included 821 condominium units (down 8.8 per cent) and 477 semi-detached homes (up 5.5 per cent).
In December, the average sale price for all residential properties in Waterloo Region was $763,840. This represents a 3.3 per cent increase compared to December 2023 and a 1.4 per cent increase compared to November 2024.
- The average price of a detached home was $898,204. This represents a 6.0 per cent increase from December 2023 and an increase of 4.0 per cent compared to November 2024.
- The average sale price for a townhouse was $630,676. This represents a 1.7 per cent increase from December 2023 and an increase of 2.7 per cent compared to November 2024.
- The average sale price for an apartment-style condominium was $475,006. This represents a 3.7 per cent decrease from December 2023 and an increase of 5.5 per cent compared to November 2024.
- The average sale price for a semi was $644,786. This represents an increase of 5.1 per cent compared to December 2023 and an increase of 0.2 per cent compared to November 2024.
Average Sale Price – Monthly

Year-to-date, the average sale price for all residential properties in Waterloo Region decreased 0.3 per cent to $784,343 compared to 2023.
- The year-to-date average price of a detached home was $910,901. This represents a 0.8 per cent decrease compared to 2023.
- The year-to-date average sale price for a townhouse was $638,385. This represents a 2.3 per cent decrease compared to 2023.
- The year-to-date average sale price for an apartment-style condominium was $472,801. This represents a 2.0 per cent decrease compared to 2023.
- The year-to-date average sale price for a semi was $662,859. This represents a decrease of 2.1 per cent compared to 2023.
Average Sale Price – Year-to-date

| Monthly MLS® Home Price Index Benchmark Price | ||||||
| Kitchener-Waterloo | Cambridge | |||||
| Benchmark Type: | December 2024 | Monthly % Change | Yr./Yr. % Change | December 2024 | Monthly % Change | Yr./Yr. % Change |
| Composite | $717,200 | -0.4 | 0.6 | $725,000 | -1.7 | 2.4 |
| Single Family | $822,100 | -0.8 | 1.9 | $758,700 | -2.1 | 4.1 |
| Townhouse | $599,000 | 1.1 | -1.7 | $630,300 | 0.6 | -3.7 |
| Apartment | $445,600 | 0.3 | -5.5 | $478,600 | -0.2 | -4.0 |
| Annual MLS® Home Price Index Benchmark Price | ||||
| Kitchener-Waterloo | Cambridge | |||
| Benchmark Type: | 2024 | Yr./Yr. % Change | 2024 | Yr./Yr. % Change |
| Composite | $734,500 | -2.6 | $747,000 | -1.0 |
| Single Family | $846,500 | -1.3 | $781,900 | -0.5 |
| Townhouse | $612,900 | -2.9 | $646,600 | -0.9 |
| Apartment | $451,200 | -5.1 | $491,000 | 0.8 |

With the introduction of 30-year amortization options for all first-time homebuyers and new construction purchases now in effect as of December 15, 2024, along with an increased cap for insured mortgages now set at $1.5 million, we are optimistic that the housing market will become more accessible for aspiring homeowners in 2025
There were 346 new listings added last month, an increase 19.7 per cent compared to December of last year and a 1.6 per cent increase compared to the previous ten-year average for December.
In 2024, 13,176 new listings were added, an increase of 14.9 per cent compared to 2023, and a 10.8 per cent increase compared to the previous ten-year annual average.
The total number of homes available for sale in active status at the end of December was 1,092, an increase of 39.5 per cent compared to December of last year and 66.6 per cent above the previous ten-year average of 656 listings for December.
The number of months of inventory across the residential market is up 35.7 per cent compared to December of last year, now at 1.9 months. December’s rolling 12-month average was 2.6 months, which has risen from the 1.67 average of the past decade. In December, condominium apartments had the highest inventory, with 4.5 months’ supply, followed by townhouses with 2.7 months’ supply and detached homes with 1.3 months’ supply. The number of months of inventory represents the time it would take to sell off current inventories at the current sales rate
The average number of days to sell in December was 36, compared to 31 days in December 2023. The previous 5-year average is 23 days.
The average days to sell in 2024 was 23 days, compared to 19 days in 2023 and a previous 5-year average of 17 days.
If you have any questions at all, are thinking of making a move this winter, or are wondering what your home might be worth, give me a call or text to 519-497-4646 or shoot me an email to kevinbakerrealestate@gmail.com and we can sit down for a coffee and chat about your family’s needs going forward.
Have a great rest of your week!
Kevin
Average Sales Price – Municipality

Average Sales Price – Township

Monthly Sales By Property Type

Monthly Supply of Homes for Sale

Monthly Supply of Homes for Sale – By Property Type

Monthly Median Sales Price – By Property Type

Monthly Average Sales Price – By Property Type

Monthly Average Days on Market

November home sales up over last year in Waterloo Region
I hope you are having a great week! It looks like winter is here a little early this year but I am sure all the skiers are enjoying things already. With the snow, that reminds us that there is less than a month till Christmas, so hopefully you have a good chunk of your shopping already done.
The Waterloo region real estate stats are out for November and sales were up over last year, which is great news! Let’s take a look….
In November, a total of 539 homes were sold in the Waterloo Region. This represents a 21.1 per cent increase compared to the same period last year and a decline of 13.1 per cent compared to the average number of homes sold in the previous ten years for the same month.
Home sales have experienced a substantial increase in November compared to last year. However, sales were down from the previous month and remain below the historical averages for the area. November has shown more balanced conditions, and the increase in available homes has benefited buyers, giving them more options. We are also seeing an abundance of condo apartments still for sale in the region as well which is keeping things sluggish in that sector of the market.
Total residential sales in November included 331 detached homes (up 23.5 per cent from November 2023), and 113 townhouses (up 37.8 per cent). Sales also included 51 condominium units (down 17.7 per cent) and 44 semi-detached homes (up 37.5 per cent).
In November, the average sale price for all residential properties in Waterloo Region was $754,604. This represents a 0.2 per cent decrease compared to November 2023 and a 3.3 per cent decrease compared to October 2024.
- The average price of a detached home was $862,690. This represents a 3.1per cent decrease from November 2023 and a decrease of 2.6 per cent compared to October 2024.
- The average sale price for a townhouse was $615,222. This represents a 0.9 per cent increase from November 2023 and a decrease of 4.9 per cent compared to October 2024.
- The average sale price for an apartment-style condominium was $452,732. This represents a 0.5 per cent increase from November 2023 and a decrease of 6.2 per cent compared to October 2024.
- The average sale price for a semi was $643,672. This represents an increase of 4.5 per cent compared to November 2023 and a decrease of 1.0 per cent compared to October 2024.
Average Sale Price – Monthly

| MLS® Home Price Index Benchmark Price | ||||||
| Kitchener-Waterloo | Cambridge | |||||
| Benchmark Type: | November 2024 | Monthly % Change | Yr./Yr. % Change | November 2024 | Monthly % Change | Yr./Yr. % Change |
| Composite | $719,600 | 0.8 | 0.6 | $737,400 | -0.1 | 1.6 |
| Single Family | $828,900 | 0.9 | 2.1 | $775,000 | -0.1 | 3.3 |
| Townhouse | $592,300 | -0.4 | -4.9 | $626,700 | -0.3 | -5.3 |
| Apartment | $444,300 | 1.1 | -2.4 | $479,600 | -0.2 | -3.3 |

Current market conditions, marked by increased inventory and stable prices, suggest that now might be a good time to buy. This is especially true for those who can take advantage of lower interest rates and recent mortgage reforms. These reforms expand eligibility for 30-year mortgage amortizations to all first-time homebuyers and buyers of new construction. Additionally, a higher limit on insured mortgages will take effect on December 15, 2024.
There were 889 new listings added last month, an increase of 2.4 per cent compared to November last year and an 18.4 per cent increase compared to the previous ten-year average for November.
The total number of homes available for sale in active status at the end of November was 1,565 an increase of 20.0 per cent compared to November of last year and 57.8 per cent above the previous ten-year average of 992 listings for November.
The total inventory across the market increased by 16.7 percent, resulting in a 2.8 month supply of all property types by the end of November. Condominium apartments had the highest inventory, with 5.9 months’ supply, followed by townhouses with 3.9 months’ supply and detached homes with 2.0 months’ supply. The number of months of inventory represents the time it would take to sell off current inventories at the current sales rate.
The average time to sell a home in November was 27 days, consistent with the previous month. In November 2023, it took 24 days for a home to sell, and the five-year average was 19 days.
If you have any questions at all, are thinking of making a move this winter, or are wondering what your home might be worth, give me a call or text to 519-497-4646 or shoot me an email to kevinbakerrealestate@gmail.com and we can sit down for a coffee and chat about your family’s needs going forward.
Have a great rest of your week!
Kevin
Average Sales Price – Municipality

Average Sales Price – Township

Monthly Sales By Property Type

Monthly Supply of Homes for Sale

Monthly Supply of Homes for Sale – By Property Type

Monthly Median Sales Price – By Property Type

Monthly Average Sales Price – By Property Type

Monthly Average Days on Market

Homes Sales Up in October in Waterloo Region
I hope you had a great Halloween weekend with the kids!! The weather was pretty good this year and I heard from many friends that they had well in excess of 100 kids with the top one being 400!! That’s crazy.
Well November is here and the stats are out for the October Waterloo Region Real Estate market. Sales were up and prices were up slightly which is a great sign that the market is starting to turn around. With the recent rate drops that is starting to get buyers off the sidelines. Let’s take a look at the stats.
In October, a total of 604 homes were sold in the Waterloo Region. This represents a 7.1 per cent increase compared to the same period last year and a decline of 14.2 per cent compared to the average number of homes sold in the previous ten years for the same month.
For the first time since May, we witnessed an encouraging rise in home sales throughout Waterloo Region last month. This positive trend reflects a shift toward more balanced conditions within our housing market and a renewed confidence among buyers.
Total residential sales in October included 383 detached homes (up 15.4 per cent from October 2023), and 104 townhouses (down 20.0 per cent). Sales also included 66 condominium units (up 1.5 per cent) and 49 semi-detached homes (up 53.1 per cent).
In October, the average sale price for all residential properties in Waterloo Region was $779,008. This represents a 1.4 per cent increase compared to October 2023 and a 1.4 per cent decrease compared to September 2024.
- The average price of a detached home was $885,587. This represents a 0.6 per cent decrease from October 2023 and a decrease of 2.9 per cent compared to September 2024.
- The average sale price for a townhouse was $643,382. This represents a 0.2 per cent decrease from October 2023 and an increase of 7.8 per cent compared to September 2024.
- The average sale price for an apartment-style condominium was $484,429. This represents a 1.8 per cent increase from October 2023 and a decrease of 0.2 per cent compared to September 2024.
- The average sale price for a semi was $650,098. This represents a decrease of 1.2 per cent compared to October 2023 and a decrease of 0.7 per cent compared to September 2024.
Average Sale Price – Monthly

| MLS® Home Price Index Benchmark Price | ||||||
| Kitchener-Waterloo | Cambridge | |||||
| Benchmark Type: | October 2024 | Monthly % Change | Yr./Yr. % Change | October 2024 | Monthly % Change | Yr./Yr. % Change |
| Composite | $713,800 | -2.1 | -2.5 | $738,400 | -0.5 | -1.8 |
| Single Family | $821,900 | -2.7 | -1.1 | $775,900 | -0.2 | -0.6 |
| Townhouse | $594,500 | -1.4 | -5.8 | $628,500 | -2.0 | -5.9 |
| Apartment | $439,500 | 0.9 | -5.7 | $480,400 | -0.2 | -4.3 |

On Wednesday, October 23, the Bank of Canada cut its policy rate by 50 basis points to 3.75 per cent. This marks the fourth consecutive rate cut since June and is the most substantial decrease since March 2020. The interest rate cuts are certainly beneficial for those with variable mortgages and encouraging news for homeowners facing mortgage renewals.
There were 1,144 new listings added in Waterloo Region last month, an increase of 0.3 per cent compared to October last year and a 19.9 per cent increase compared to the previous ten-year average for October.
The total number of homes available for sale in active status at the end of October was 1,711 an increase of 21.0 per cent compared to October of last year and 48.5 per cent above the previous ten-year average of 1,153 listings for October.
The total inventory across the market increased by 19.2 percent, resulting in a 3.1-month supply of all property types by the end of October. Condominium apartments had the highest inventory, with 5.5 months’ supply, followed by townhouses with 3.8 months’ supply and detached homes with 2.5 months’ supply. The number of months of inventory represents the time it would take to sell off current inventories at the current sales rate.
The average time to sell a home in October was 27 days, one day shorter than the previous month. In October 2023, it took 21 days for a home to sell, and the five-year average is 18 days.
If you have any questions at all, are thinking of making a move this winter, or are wondering what your home might be worth, give me a call or text to 519-497-4646 or shoot me an email to kevinbakerrealestate@gmail.com and we can sit down for a coffee and chat about your family’s needs going forward.
Have a great week!
Kevin
Average Sales Price – Municipality

Average Sales Price – Township

Monthly Sales By Property Type

Monthly Supply of Homes for Sale

Monthly Supply of Homes for Sale – By Property Type

Monthly Median Sales Price – By Property Type
Monthly Average Sales Price – By Property Type

Monthly Average Days on Market

Waterloo Region see’s decrease in home sales in September
I hope you had a great week and are looking forward to the weekend. The weather has been so nice in September but I am sure fall is just around the corner. The stats are out for September in the Waterloo Region Housing market and Sales were down once again but prices were up slightly. Let’s take a look at the numbers…
In September, a total of 521 homes were sold in the Waterloo Region. This represents a decrease of 2.1 per cent compared to the same period last year and a decline of 23.5 per cent compared to the average number of homes sold in the previous ten years for the same month.
There has been an overall slowdown in home sales, but we continued to see strong demand for detached homes, resulting in an increase in sales for that specific type of property last month. The buyers have a bit more selection than a year ago as inventory is up, and homes take a little longer to sell. This can mean a less stressful homebuying experience, but for sellers, the current market may require more patience or even adjustment in price expectation.
Total residential sales in September included 336 detached homes (up 9.4 per cent from September 2023), and 95 townhouses (down 22.1 per cent). Sales also included 57 condominium units (down 16.2 per cent) and 32 semi-detached homes (down 3.0 per cent).
In September, the average sale price for all residential properties in Waterloo Region was $788,944. This represents a 2.9 per cent increase compared to September 2023 and a 2.3 per cent increase compared to August 2024.
- The average price of a detached home was $910,286. This represents a 2.3 per cent increase from September 2023 and an increase of 2.2 per cent compared to August 2024.
- The average sale price for a townhouse was $595,435. This represents a 6.9 per cent decrease from September 2023 and a decrease of 2.7 per cent compared to August 2024.
- The average sale price for an apartment-style condominium was $483,331. This represents a decrease of 3.4 per cent from September 2023 and an increase of 4.9 per cent compared to August 2024.
- The average sale price for a semi was $654,613. This represents a decrease of 2.9 per cent compared to September 2023 and an increase of 0.1 per cent compared to August 2024.
Average Sale Price – Monthly

| MLS® Home Price Index Benchmark Price | ||||||
| Kitchener-Waterloo | Cambridge | |||||
| Benchmark Type: | September 2024 | Monthly % Change | Yr./Yr. % Change | September 2024 | Monthly % Change | Yr./Yr. % Change |
| Composite | $728,700 | 0.2 | -1.8 | $741,800 | -0.1 | 0.0 |
| Single Family | $844,400 | 0.6 | 0.3 | $777,500 | 0.2 | 1.3 |
| Townhouse | $602,800 | -0.7 | -5.5 | $641,700 | -1.7 | -4.8 |
| Apartment | $435,700 | -1.3 | -8.3 | $481,500 | -0.2 | -4.2 |

In September, the federal government made some policy changes. These changes include extending mortgage terms to 30 years for first-time homebuyers and all buyers of new builds and raising the CMHC insurance cap from $1 million to $1.5 million. These changes will come into effect later this year. Combined with anticipated further interest rate cuts, these adjustments could enable more buyers to purchase their first home.
There were 1,313 new listings added last month, a decrease of 6.5 per cent compared to September last year and a 20.0 per cent increase compared to the previous ten-year average for September.
The total number of homes available for sale in active status at the end of September was 1,751 an increase of 21.3 per cent compared to September of last year and 42.2 per cent above the previous ten-year average of 1,232 listings for September.
The total inventory across the market increased by 23.1 percent, resulting in a 3.2-month supply of all property types by the end of September. Condominium apartments had the highest inventory, with 5.5 months’ supply, followed by townhouses with 3.6 months’ supply and detached homes with 2.7 months’ supply. The number of months of inventory represents the time it would take to sell off current inventories at the current sales rate.
The average time it took to sell a home in September was 28 days, which is three days longer than the previous month. In September 2023, it took 19 days for a home to sell, and the five-year average is 18 days.
If you have any questions at all, are thinking of making a move this fall and wondering what your home might be worth, give me a call or text to 519-497-4646 or shoot me an email to kevinbakerrealestate@gmail.com and we can sit down for a coffee and chat about your family’s needs going forward.
Enjoy your Thanksgiving with your families next weekend!
Kevin
Average Sales Price – Municipality

Average Sales Price – Township

Monthly Sales By Property Type

Monthly Supply of Homes for Sale

Monthly Supply of Homes for Sale – By Property Type

Monthly Median Sales Price – By Property Type

Monthly Average Sales Price – By Property Type

Monthly Average Days on Market

Waterloo Region Sees Stronger Demand for Single Detached Homes Amid Slower Residential Sales
I hope you had a great Labour day weekend and with all the kids back to school, life is getting back to routine again. The fall market will be here soon enough and with that the colder weather again.
The stats are out for August and a total of 539 homes were sold in the Waterloo Region. This represents a decrease of 5.3 per cent compared to the same period last year and a decline of 24.1 per cent compared to the average number of homes sold in the previous ten years for the same month.
Despite a cooling market, detached homes continue to see strong demand, reflected in a 6.0 percent increase in sales year-over-year. With home prices showing stability in recent months and interest rates decreasing, we saw some home buyers finally come out from the wings to take advantage of the summer slowdown to seek out specific property types, like single-family homes.
Total residential sales in August included 335 detached homes (up 6.0 per cent from August 2023), and 103 townhouses (down 22.6 per cent). Sales also included 60 condominium units (down 18.9 per cent) and 40 semi-detached homes (down 11.1 per cent).
In August, the average sale price for all residential properties in Waterloo Region was $769,203. This represents a 1.1 per cent increase compared to August 2023 and a 1.7 per cent decrease compared to July 2024.
- The average price of a detached home was $889,085. This represents a 0.8 per cent increase from August 2023 and a decrease of 2.7 per cent compared to July 2024.
- The average sale price for a townhouse was $611,164. This represents a 7.5 per cent decrease from August 2023 and a decrease of 1.5 per cent compared to July 2024.
- The average sale price for an apartment-style condominium was $457,075. This represents a decrease of 5.8 per cent from August 2023 and a decrease of 7.7 per cent compared to July 2024.
- The average sale price for a semi was $654,070. This represents a decrease of 2.8 per cent compared to August 2023 and a decrease of 1.9 per cent compared to July 2024.
Average Sale Price – Monthly

| MLS® Home Price Index Benchmark Price | ||||||
| Kitchener-Waterloo | Cambridge | |||||
| Benchmark Type: | August 2024 | Monthly % Change | Yr./Yr. % Change | August 2024 | Monthly % Change | Yr./Yr. % Change |
| Composite | $727,200 | -0.5 | -3.3 | $742,500 | -0.1 | -2.1 |
| Detached | $839,300 | 0.0 | -1.9 | $776,300 | -0.1 | -1.6 |
| Townhouse | $606,800 | -1.8 | -5.6 | $652,800 | 0.3 | -1.9 |
| Apartment | $441,300 | -3.0 | -7.1 | $482,600 | -2.7 | -4.2 |

While we’re seeing increased inventory and longer days on the market, this trend might not last if the Bank of Canada continues to lower interest rates. Buyers will need to weigh the benefits of potentially lower rates against the possibility of rising prices as demand picks up.
There were 988 new listings added last month, a decrease of 4.2 per cent compared to August last year and a 7.3 per cent increase compared to the previous ten-year average for August.
The total number of homes available for sale in active status at the end of August was 1,640 an increase of 49.2 per cent compared to August of last year and 40.1 per cent above the previous ten-year average of 1,308 listings for August.
The total inventory across the market increased by 50.0 percent, resulting in a 3.0-month supply of all property types by the end of August. Condominium apartments had the highest inventory, with 5.3 months’ supply, followed by townhouses with 3.5 months’ supply and detached homes with 2.5 months’ supply. The number of months of inventory represents the time it would take to sell off current inventories at the current sales rate.
The average time it took to sell a home in August was 25 days, which is three days longer than the previous month. In August 2023, it took 19 days for a home to sell, and the five-year average is 19 days.
If you have any questions at all, are thinking of making a move this fall and wondering what your home might be worth, give me a call or text to 519-497-4646 or shoot me an email to kevinbakerrealestate@gmail.com and we can sit down for a coffee and chat about your family’s needs going forward.
Enjoy the rest of your September!
Kevin
Average Sales Price – Municipality

Average Sales Price – Township

Monthly Sales By Property Type

Monthly Supply of Homes for Sale

Monthly Supply of Homes for Sale – By Property Type

Monthly Median Sales Price – By Property Type

Monthly Average Sales Price – By Property Type

Monthly Average Days on Market

July Home Sales and Prices Up Slightly over June in Kitchener Waterloo and Cambridge
I hope you are having a great summer and enjoyed the Civic Long weekend. The weather has been so warm and with the city’s different events every weekend there is always something to do!
The stats are out for July and a total of 639 homes were sold in the Waterloo Region. This represents an increase of 4.6 per cent compared to the same period last year and a decline of 16.6 per cent compared to the average number of homes sold in the previous ten years for the same month.
We observed a slight increase in home sales year-over-year following a reduction in interest rates. While this uptick is encouraging, it is evident that many potential buyers are adopting a wait-and-see approach, anticipating further decreases in interest rates and better buying conditions in the near future.
Total residential sales in July included 382 detached homes (up 4.1 per cent from July 2023), and 126 townhouses (up 5.0 per cent). Sales also included 82 condominium units (up 9.3 per cent) and 48 semi-detached homes (up 9.1 per cent).
In July, the average sale price for all residential properties in Waterloo Region was $782,716. This represents a 1.6 per cent decrease compared to July 2023 and a 0.9 per cent decrease compared to June 2024.
- The average price of a detached home was $914,469. This represents a 0.6 per cent decrease from July 2023 and an increase of 1.6 per cent compared to June 2024.
- The average sale price for a townhouse was $617,062. This represents a 7.7 per cent decrease from July 2023 and a decrease of 7.1 per cent compared to June 2024.
- The average sale price for an apartment-style condominium was $494,897. This represents a decrease of 0.6 per cent from July 2023 and an increase of 7.1 per cent compared to June 2024.
- The average sale price for a semi was $667,063. This represents a decrease of 0.6 per cent compared to July 2023 and an increase of 2.7 per cent compared to June 2024.
Average Sale Price – Monthly

| MLS® Home Price Index Benchmark Price | ||||||
| Kitchener-Waterloo | Cambridge | |||||
| Benchmark Type: | July 2024 | Monthly % Change | Yr./Yr. % Change | July 2024 | Monthly % Change | Yr./Yr. % Change |
| Composite | $731,100 | -1.4 | -5.3 | $743,100 | -1.6 | -2.9 |
| Detached | $839,100 | -1.6 | -4.4 | $776,700 | -1.9 | -2.7 |
| Townhouse | $617,900 | -1.3 | -5.8 | $651,000 | -0.2 | -1.3 |
| Apartment | $454,800 | -0.2 | -6.2 | $496,100 | 1.1 | 0.3 |

There were 1,391 new listings added last month, an increase of 15.9 per cent compared to July last year and a 27.5 per cent increase compared to the previous ten-year average for July.
The total number of homes available for sale in active status at the end of July was 1,817 an increase of 61.9 per cent compared to July of last year and 38.9 per cent above the previous ten-year average of 1,308 listings for July.
Market-wide inventory levels were up 65.0 per cent, with 3.3 months’ supply for all property types at the end of July. The property type that gained the most inventory was the townhouse segment, which increased by 85.0 percent. That amounts to 5.7 months’ supply for condo apartments, 3.7 months for townhouses, and 2.8 months for detached homes. The number of months of inventory represents the amount of time it would take to sell off current inventories at the current sales rate.
The average time it took to sell a home in July was 22 days, which is four days longer than the previous month. In July 2023, it took 16 days for a home to sell, and the five-year average is 17 days.
If you have any questions at all, are thinking of making a move this summer or fall and wondering what your home might be worth, give me a call or text to 519-497-4646 or shoot me an email to kevinbakerrealestate@gmail.com and we can sit down for a coffee and chat about your family’s needs going forward.
Enjoy the rest of your August and maybe I will see you at the Kitchener Waterloo Blues Festival next weekend!
Kevin
.Average Sales Price – Municipality

Average Sales Price – Township

Monthly Sales By Property Type

Monthly Supply of Homes for Sale

Monthly Supply of Homes for Sale – By Property Type

Monthly Median Sales Price – By Property Type

Monthly Average Sales Price – By Property Type

Monthly Average Days on Market

Market cooling providing more opportunity for buyers here in Waterloo Region
I hope you are having a great start to summer and enjoyed the Canada Day Long weekend. I know the golfers have had some mixed weather but for the most part the grass is still nice and green.
The stats are out for June and we have seen some cooling in the real estate market here in Waterloo Region. Listing inventory is growing and it seems that the buyers are staying on the sidelines waiting for rates to come down a little more. Let’s dive into the stats to take a look…
In June, a total of 674 homes were sold, which represents a decrease of 13.7 per cent compared to the same period last year and a decline of 24.8 per cent compared to the average number of homes sold in the previous ten years for the same month.
Total residential sales in June included 424 detached (down 9.6 per cent from June 2023), and 136 townhouses (down 8.7 per cent). Sales also included 66 condominium units (down 44.5 per cent) and 47 semi-detached homes (up 14.6 per cent).
In June, the average sale price for all residential properties in Waterloo Region was $790,945. This represents a 5.8 per cent decrease compared to June 2023 and a 3.3 per cent decrease compared to May 2024.
- The average price of a detached home was $900,307. This represents a 10.3 per cent decrease from June 2023 and a decrease of 4.6 per cent compared to May 2024.
- The average sale price for a townhouse was $663,642. This represents a 0.6 per cent decrease from June 2023 and an increase of 2.0 per cent compared to May 2024.
- The average sale price for an apartment-style condominium was $462,145. This represents a decrease of 1.8 per cent from June 2023 and an increase of 0.5 per cent compared to May 2024.
- The average sale price for a semi was $649,353. This represents a decrease of 6.7 per cent compared to June 2023 and a decrease of 7.2 per cent compared to May 2024.
Average Sale Price – Monthly

| MLS® Home Price Index Benchmark Price | ||||||
| Kitchener-Waterloo | Cambridge | |||||
| Benchmark Type: | June 2024 | Monthly % Change | Yr./Yr. % Change | June 2024 | Monthly % Change | Yr./Yr. % Change |
| Composite | $741,500 | -1.4 | -5.6 | $755,200 | -0.7 | -3.1 |
| Detached | $852,900 | -1.6 | -5.1 | $791,900 | -0.6 | -3.1 |
| Townhouse | $626,400 | -1.2 | -3.9 | $652,600 | -0.7 | -0.6 |
| Apartment | $455,800 | -0.5 | -4.7 | $490,600 | -1.1 | 1.6 |

The average selling price for residential properties has decreased by 5.8 per cent since June 2023, with detached homes showing the most significant drop at 10.3 percent. This indicates a broader softness in the market and a shifting from a Sellers market to a more balanced market at the moment. The silver lining is this presents a more favourable pricing environment for buyers, with more choices, greater flexibility, and the potential to negotiate better deals.
There were 1,431 new listings added last month, an increase of 7.6 per cent compared to June last year and a 10.6 per cent increase compared to the previous ten-year average for June.
The total number of homes available for sale in active status at the end of June was 1,790, an increase of 75.5 per cent compared to June of last year and 31.9 per cent above the previous ten-year average of 1,357 listings for June.
Market-wide inventory levels were up 73.7 per cent, with 3.3 months’ supply for all property types at the end of June. The property type that gained the most inventory was the condo apartment segment, which increased by 103.1 percent. That amounts to 6.5 months’ supply for condo apartments, 2.8 months for detached homes, and 3.2 months for townhouses. The number of months of inventory represents the amount of time it would take to sell off current inventories at the current sales rate.
The average number of days to sell in June was 18, compared to 15 days in June 2023. The previous 5-year average is 15 days.
If you have any questions at all, are thinking of making a move this summer and wondering what your home might be worth, give me a call or text to 519-497-4646 and we can sit down for a coffee and chat about your family’s needs going forward.
Enjoy the rest of your July!
Kevin
Average Sales Price – Municipality

Average Sales Price – Township

Monthly Sales By Property Type

Monthly Supply of Homes for Sale

Monthly Supply of Homes for Sale – By Property Type

Monthly Median Sales Price – By Property Type

Monthly Average Sales Price – By Property Type

Monthly Average Days on Market

Waterloo Region Housing Market Sluggish in May 2024
I hope you are having a great start to June. My apologies for sending this out later than usual but I just got back from a week out on the east coast. My youngest son got married in Moncton on June 1st. The wedding couple looked beautiful and everyone that attended seemed to have a great time.
We also got news last week that rates have come down slightly. The Bank of Canada dropped the key overnight lending rate ¼ point to 4.75%. I don’t see a huge impact on the market just yet but it’s a good start to helping Canadians get into more affordable housing.
The stats are out for May in the Waterloo Region Real Estate market. The market showed signs of sluggishness mainly due to the condo market. Single detached sales were down slightly while the condo market was down quite substantially as a whole. Inventory levels have risen sharply which is giving buyers much more to choose from when they are looking to buy their next home. Let’s take a look at the numbers.
In May, a total of 742 homes were sold in Waterloo Region. This represents a decrease of 8.1 per cent compared to the same period last year and a decline of 20.0 per cent compared to the average number of homes sold in the previous ten years for the same month.
We saw a dip in the number of sales across all categories in May, with condo apartments experiencing the largest drop. The Condo market also had the greatest supply level, posing a challenge for sellers, especially for units with one or fewer bedrooms, where the current inventory level exceeds buyer demand.
Total residential sales in May included 467 detached (down 1.3 per cent from May 2023), and 134 townhouses (down 3.6 per cent). Sales also included 82 condominium units (down 34.4 per cent) and 59 semi-detached homes (down 13.2 per cent).
In May, the average sale price for all residential properties in Waterloo Region was $818,507. This represents a 0.3 per cent decrease compared to May 2023 and a 2.3 per cent increase compared to April 2024.
- The average price of a detached home was $943,859. This represents a 1.9 per cent decrease from May 2023 and an increase of 0.4 per cent compared to April 2024.
- The average sale price for a townhouse was $653,761. This represents a 6.1 per cent decrease from May 2023 and a decrease of 0.9 per cent compared to April 2024.
- The average sale price for an apartment-style condominium was $459,260. This represents a decrease of 5.6 per cent from May 2023 and a decrease of 5.6 per cent compared to April 2024.
- The average sale price for a semi was $699,780. This represents a decrease of 3.9 per cent compared to May 2023 and an increase of 5.1 per cent compared to April 2024.
Average Sale Price – Monthly

| MLS® Home Price Index Benchmark Price | ||||||
| Kitchener-Waterloo | Cambridge | |||||
| Benchmark Type: | May 2024 | Monthly % Change | Yr./Yr. % Change | May 2024 | Monthly % Change | Yr./Yr. % Change |
| Composite | $752,100 | 0.3 | -4.2 | $760,300 | 0.5 | -4.0 |
| Detached | $866,900 | 0.1 | -3.4 | $796,400 | 0.8 | -4.3 |
| Townhouse | $634,100 | 1.2 | -1.0 | $657,300 | -0.1 | 1.4 |
| Apartment | $458,200 | 0.6 | -6.0 | $495,900 | -1.6 | 2.8 |

This spring, we are witnessing a significant increase in the availability of apartment-style condos, with a record high number of units on the market. At the same time, we are observing a shift in demand away from smaller-sized condo units, potentially influenced by the higher interest rates impacting investor market activity for this property type.
There were 1,644 new listings added last month, an increase of 28.9 per cent compared to May last year and a 15.8 per cent increase compared to the previous ten-year average for May.
The total number of homes available for sale in active status at the end of May was 1,741, an increase of 95.8 per cent compared to May of last year and 27.9 per cent above the previous ten-year average of 1,361 listings for May.
Market-wide inventory levels were up 93.8 per cent, with 3.1 months’ supply for all property types at the end of May. The property type that gained the most inventory was the condo apartment segment, which increased by 100 percent. That amounts to 6.0 months’ supply for condo apartments, 2.4 months for detached homes, and 3.6 months for Townhouses. The number of months of inventory represents the amount of time it would take to sell off current inventories at the current sales rate.
The average number of days to sell in May was 16, compared to 14 days in May 2023. The previous 5-year average is 15 days.
Average Sales Price – Municipality

Average Sales Price – Township

Monthly Sales By Property Type

Monthly Supply of Homes for Sale

Monthly Supply of Homes for Sale – By Property Type

Monthly Median Sales Price – By Property Type

Monthly Average Sales Price – By Property Type

Monthly Average Days on Market

If you have any questions at all, are thinking of making a move this summer and wondering what your home might be worth, give me a call or text to 519-497-4646 and we can sit down for a coffee and chat about your family’s needs going forward.
Enjoy the rest of your June and Happy Fathers Day to all the dads out there next weekend!
Kevin
Waterloo Region sees slight sales growth along strong increase in homes for sale in April
I hope you are having a great start to May. The weather has been warming up and the garden centres are starting to get busy!
The Real Estate market here in Waterloo Region has started to get busier now that spring is here as well. The numbers are out for April so let’s take a look at the stats.
In April, a total of 692 homes were sold, this represents an increase of 3.3% compared to the same period last year and a decline of 12.3% compared to the average number of homes sold in the previous 5 years for the same month.
The real estate market appears to be balancing out last month. The market experienced a slight increase in home sales and moderate price fluctuations. Additionally, the number of homes for sale reached an eight-year high for the month of April, which translates to more available options for potential buyers.
Total residential sales in April included 406 detached (up 0.5 per cent from April 2023), and 137 townhouses (up 15.1 per cent). Sales also included 90 condominium units (down 5.3 per cent) and 57 semi-detached homes (up 11.8 per cent).
In April, the average sale price for all residential properties in Waterloo Region was $800,087. This represents a 0.3 per cent increase compared to April 2023 and a 0.7 per cent decrease compared to March 2024.
- The average price of a detached home was $938,478. This represents a 1.4 per cent increase from April 2023 and a decrease of 1.8 per cent compared to March 2024.
- The average sale price for a townhouse was $660,945. This represents a 0.5 per cent decrease from April 2023 and a decrease of 0.8 per cent compared to March 2024.
- The average sale price for an apartment-style condominium was $485,556. This represents a decrease of 1.1 per cent from April 2023 and an increase of 0.5 per cent compared to March 2024.
- The average sale price for a semi was $665,936. This represents a decrease of 3.0 per cent compared to April 2023 and a decrease of 2.1 per cent compared to March 2024.
Average Sale Price – Monthly

| MLS® Home Price Index Benchmark Price | ||||||
| Kitchener-Waterloo | Cambridge | |||||
| Benchmark Type: | April 2024 | Monthly % Change | Yr./Yr. % Change | April 2024 | Monthly % Change | Yr./Yr. % Change |
| Composite | $745,000 | 0.6 | -1.9 | $759,000 | 1.5 | -0.1 |
| Detached | $860,400 | 0.8 | -0.7 | $794,100 | 1.8 | 0.1 |
| Townhouse | $619,200 | 0.7 | 0.3 | $659,600 | 1.1 | 2.8 |
| Apartment | $458,400 | -0.8 | -3.8 | $490,100 | -0.1 | 2.0 |

There were 1,443 new listings added last month, an increase of 65.3 per cent compared to April last year and a 15.5 per cent increase compared to the previous ten-year average for April.
The total number of homes available for sale in active status at the end of April was 1,390, an increase of 101.4 per cent compared to April of last year and 13.6 per cent above the previous ten-year average of 1,224 listings for April.
At the end of April, there were 2.5 months of inventory, a 108.3 percent increase compared to last year and 38.1 percent above the previous 10-year average. The number of months of inventory represents how long it would take to sell off current inventories at the current sales rate.
The average number of days to sell in April was 18, compared to 16 days in April 2023. The previous 5-year average is 15 days.
If you have any questions at all, are thinking of making a move this spring and wondering what your home might be worth, give me a call or text to 519-497-4646 and we can sit down for a coffee and chat about your family’s needs going forward.
Enjoy the rest of your May and Happy Mothers Day to all the moms out there next weekend!
Kevin
Average Sales Price – Municipality

Average Sales Price – Township

Monthly Sales By Property Type

Monthly Supply of Homes for Sale

Monthly Supply of Homes for Sale – By Property Type

Monthly Median Sales Price – By Property Type

Monthly Average Sales Price – By Property Type

Monthly Average Days on Market

Record Low Home Sales in March for Waterloo Region
I hope you had a nice Easter long weekend with the family last week and got to enjoy some time together making new memories. The Easter bunny came to our place too in the form of 4 new chickens and 2 ducks for our newly constructed coop 🙂
The stats for March came out and Waterloo Region experienced record low home sales. The market is tight for inventory once again and multiple offers are showing up for well priced homes in the 700-900k range.
Let’s take a look at the numbers….
In March, a total of 596 homes were sold, this represents a decrease of 3.2% compared to the same period last year and a decline of 33.4% compared to the average number of homes sold in the previous 5 years for the same month.
Despite the challenging market conditions, the first quarter of 2024 saw an increase in home sales, marking an 8.0 per cent rise compared to the previous year. However, these figures still fall short of the first-quarter sales of the past decade.
While home sales in Waterloo Region hit a record low for March in over two decades, we’re also witnessing a positive trend. Over the past three months, prices and activity have started to pick up, and I expect this momentum will continue into the spring.
Total residential sales in March included 344 detached (down 3.9 per cent from March 2023), and 127 townhouses (down 0.8 per cent). Sales also included 86 condominium units (down 1.1 per cent) and 37 semi-detached homes (down 11.9 per cent).
In March, the average sale price for all residential properties in Waterloo Region was $806,279. This represents a 3.6 per cent increase compared to March 2023 and a 6.6 per cent increase compared to February 2024.
- The average price of a detached home was $954,342. This represents a 4.9 per cent increase from March 2023 and an increase of 7.3 per cent compared to February 2024.
- The average sale price for a townhouse was $667,810. This represents a 4.4 per cent increase from March 2023 and an increase of 6.0 per cent compared to February 2024.
- The average sale price for an apartment-style condominium was $483,085. This represents an increase of 0.3 per cent from March 2023 and an increase of 5.3 per cent compared to February 2024.
- The average sale price for a semi was $680,039. This represents a decrease of 2.9 per cent compared to March 2023 and an increase of 1.0 per cent compared to February 2024.
Average Sale Price – Monthly

| MLS® Home Price Index Benchmark Price | ||||||
| Kitchener-Waterloo | Cambridge | |||||
| Benchmark Type: | March 2024 | Monthly % Change | Yr./Yr. % Change | March 2024 | Monthly % Change | Yr./Yr. % Change |
| Composite | $740,900 | 1.6 | 0.0 | $747,500 | 0.7 | 0.9 |
| Detached | $853,800 | 1.5 | 1.3 | $780,100 | 0.8 | 1.1 |
| Townhouse | $614,900 | 2.3 | 1.3 | $652,400 | 0.6 | 2.4 |
| Apartment | $461,900 | 2.1 | -0.7 | $490,500 | 2.8 | 3.4 |

Home prices have been gradually increasing since December, which is a typical trend that we see going into a spring market. The rate and extent of further increases will depend on the willingness and patience of potential home buyers who have been waiting for lower interest rates before making their purchase. With the Bank of Canada not anticipated to make any rate changes before its June meeting, some potential home buyers may feel stuck in limbo.
There were 1,023 new listings added last month, an increase of 18.7 per cent compared to March last year and a 15.9 percent decrease compared to the previous ten-year average for March.
The total number of homes available for sale in active status at the end of March was 1,081 an increase of 54.0 per cent compared to March of last year and 1.1 per cent below the previous ten-year average of 1,093 listings for March.
At the end of March, there were 1.9 months of inventory, a 58.3 percent increase compared to last year and 18.8 percent above the previous 10-year average. The number of months of inventory represents how long it would take to sell off current inventories at the current sales rate.
The average number of days to sell in March was 19, the same number as March 2023. The previous 5-year average was 18 days.
If you are thinking about buying a new home, It is my belief that we are going to see home prices rise throughout 2024 and once the Bank of Canada starts lowering rates the acceleration of prices will increase as buyers that have been sitting on the sidelines will jump back into the market.
If you have any questions at all, are thinking of making a move this spring and wondering what your home might be worth, give me a call or text to 519-497-4646 and we can sit down for a coffee and chat about your family’s needs going forward.
Enjoy the rest of your April and the nice weather that is coming.
Kevin
Average Sales Price – Municipality

Average Sales Price – Township

Monthly Sales By Property Type

Monthly Supply of Homes for Sale

Monthly Supply of Homes for Sale – By Property Type

Monthly Median Sales Price – By Property Type

Monthly Average Sales Price – By Property Type

Monthly Average Days on Market

Homes Sales Sluggish but Prices Remain Steady in Waterloo Region for February.
I hope you and your family have been enjoying the great weather we have had over the winter. Although the skiers out there probably are not very happy, I personally love the mild weather.
The stats are out for February and sales were pretty sluggish overall but prices are remaining steady due to low inventory levels. Let’s take a look at the numbers….
In February, there were 485 homes sold, representing an increase of 9.7 per cent compared to the previous year and a decline of 19.0 per cent compared to the previous 10-year average for the month.
Home sales remained sluggish in February, up over last year’s record-breaking low, but still well below historical norms for February.
Total residential sales in February included 281 detached (up 9.3 per cent from February 2023), and 110 townhouses (up 10.0 per cent). Sales also included 73 condominium units (up 30.4 per cent) and 24 semi-detached homes (down 14.3 per cent).
In February, the average sale price for all residential properties in Waterloo Region was $755,934. This represents a 0.7 per cent decrease compared to February 2023 and a 0.7 per cent decrease compared to January 2024.
- The average price of a detached home was $889,280. This represents a 0.5 per cent increase from February 2023 and a decrease of 2.2 per cent compared to January 2024.
- The average sale price for a townhouse was $629,734. This represents a 2.2 per cent decrease from February 2023 and a decrease of 1.8 per cent compared to January 2024.
- The average sale price for an apartment-style condominium was $459,455. This represents an increase of 0.2 per cent from February 2023 and an increase of 3.1 per cent compared to January 2024.
- The average sale price for a semi was $673,638. This represents an increase of 1.0 per cent compared to February 2023 and an increase of 4.2 per cent compared to January 2024.
Average Sale Price – Monthly

WRAR cautions that average sale price information can be useful in establishing long-term trends but should not be used as an indicator that specific properties have increased or decreased in value. The MLS® Home Price Index (HPI) provides the best way to gauge price trends because averages are strongly distorted by changes in the mix of sales activity from one month to the next.
| MLS® Home Price Index Benchmark Price | ||||||
| Kitchener-Waterloo | Cambridge | |||||
| Benchmark Type: | February 2024 | Monthly % Change | Yr./Yr. % Change | February 2024 | Monthly % Change | Yr./Yr. % Change |
| Composite | $729,300 | 2.0 | 0.0 | $742,600 | -0.7 | 0.9 |
| Detached | $841,000 | 2.5 | 1.8 | $774,300 | -0.5 | 1.2 |
| Townhouse | $601,200 | 0.6 | 0.8 | $648,500 | -1.6 | 2.2 |
| Apartment | $452,500 | 1.9 | -3.8 | $477,100 | -2.0 | -1.3 |

Examining benchmark and average prices for various property types over the past twelve months reveals a stable housing market in Waterloo Region. With the approaching spring market, both buyers and sellers can take comfort in the steadiness of prices we’ve seen, reinforcing the value of homeownership as a secure and prudent investment in the long run.
There were 800 new listings added last month, an increase of 18.7 per cent compared to February last year and a 6.9 per cent decrease compared to the previous ten-year average for February.
The total number of homes available for sale in active status at the end of February was 943 an increase of 38.9 per cent compared to February of last year and 2.9 per cent below the previous ten-year average of 971 listings for February.
At the end of February, there were 1.7 months of inventory, a 54.5 percent increase compared to last year and 17.2 percent above the previous 10-year average. The number of months of inventory represents how long it would take to sell off current inventories at the current sales rate.
The average number of days to sell in February was 23, compared to 20 days in February 2023. The previous 5-year average was 16 days.
Average Sales Price – Municipality

Average Sales Price – Township

Monthly Sales By Property Type

Monthly Supply of Homes for Sale

Monthly Supply of Homes for Sale – By Property Type

Monthly Median Sales Price – By Property Type

Monthly Average Sales Price – By Property Type

Monthly Average Days on Market

If you have any questions on the stats or are thinking of making a move in the next few months, feel free to give me a call or text to 519-497-4646 or email kevinbakerrealestate@gmail.com and let’s sit down for a coffee and chat about your families needs.
Have a great march break with the kids and a fantastic St Paddy’s day!
Talk soon
Kevin
January Housing Market slightly up in Waterloo Region
I hope you are and your family are enjoying the mild winter we have had so far. The ground hogs predicted an early spring, which is not good news for all the skiiers.
The stats are out for the housing market here in Waterloo Region for January. Lets take a look at the numbers.
In January, there were 375 homes sold, representing an increase of 25.4 per cent compared to the previous year and a decline of 7.4 per cent compared to the previous 10-year average for the month.
January is traditionally a slower time of year for home sales, but it’s reassuring to see the increase compared to last year. This time last year, we hit an all-time low in January home sales, and while this year has begun with sales below the historical average, the market is showing signs of improvement.
Total residential sales in January included 206 detached (up 15.7 per cent from January 2023), and 85 townhouses (up 39.3 per cent). Sales also included 56 condominium units (up 30.2 per cent) and 19 semi-detached homes (up 11.8 per cent).
In January, the average sale price for all residential properties in Waterloo Region was $762,174. This represents a 0.1 per cent decrease compared to January 2023 and a 3.2 per cent increase compared to December 2023.
- The average price of a detached home was $911,262. This represents a 2.9 per cent increase from January 2023 and an increase of 7.5 per cent compared to December 2023.
- The average sale price for a townhouse was $638,162. This represents a 2.0 per cent increase from January 2023 and an increase of 2.7 per cent compared to December 2023.
- The average sale price for an apartment-style condominium was $446,146. This represents a decrease of 10.0 per cent from January 2023 and a decrease of 8.7 per cent compared to December 2023.
- The average sale price for a semi was $631,995. This represents a decrease of 2.9 per cent compared to January 2023 and an increase of 3.1 per cent compared to December 2023.
Average Sale Price – Monthly

| MLS® Home Price Index Benchmark Price | ||||||
| Kitchener-Waterloo | Cambridge | |||||
| Benchmark Type: | January 2024 | Monthly % Change | Yr./Yr. % Change | January 2024 | Monthly % Change | Yr./Yr. % Change |
| Composite | $714,600 | 1.3 | 0.1 | $747,800 | 5.8 | 3.8 |
| Detached | $820,700 | 2.8 | 2.6 | $777,900 | 7.0 | 4.3 |
| Townhouse | $597,500 | -0.7 | -0.4 | $658,700 | 0.2 | 3.7 |
| Apartment | $444,000 | -5.9 | -7.3 | $487,100 | -2.2 | 0.2 |

We are optimistic that this year will have more stability than last. With the Bank of Canada holding steady at a 5.0% benchmark interest rate, they recognize the overall economy has slowed down. However, housing is a key metric, and we expect the Bank to maintain a balanced response so long as housing continues with moderate growth in 2024 rather than any dramatic increases.
There was 720 new listings added last month, an increase of 23.5 per cent compared to January last year and a 3.9 per cent decrease compared to the previous ten-year average for January.
The total number of homes available for sale in active status at the end of January was 855 an increase of 33.4 per cent compared to January of last year and 1.2 per cent below the previous ten-year average of 865 listings for January.
At the end of January, there were 1.5 months of inventory, a 50.0 percent increase compared to last year and 15.4 percent above the previous 10-year average. The number of months of inventory represents how long it would take to sell off current inventories at the current sales rate.
With the exception of condo apartment property types, we saw mostly yearly and monthly price gains across the housing types. This is because there is more supply in the condo segment (2.8 months) compared to the other property types.
The average number of days to sell in January was 33, compared to 25 days in January 2023. The previous 5-year average is 20 days.
If you are thinking of making a move in the next couple of months or are just wondering what your neighbors home sold for, please give me a call or text at 519-497-4646 or email kevinbakerrealestate@gmail.com.
Lets sit down for a coffee and talk about your families needs going forward.
Have a wonderful February!
Kevin
Average Sales Price – Municipality

Average Sales Price – Township

Monthly Sales By Property Type

Monthly Supply of Homes for Sale

Monthly Supply of Homes for Sale – By Property Type

Monthly Median Sales Price – By Property Type

Monthly Average Sales Price – By Property Type

Monthly Average Days on Market
Homes Sales Decline Significantly here in Waterloo Region.
Happy New Year!! I hope that you enjoyed the holiday season and made some wonderful memories with your families. Unfortunatley it was not a white Christmas but I know those skiers out there are anxiously awaiting the snow to arrive so they can hit the slopes.
The stats are out for 2023 and the market definitly struggled in the sales catagory. With interest rates at 20 year highs and inventory still tight it kept prices relativly stable but sales down significantly. Lets take a look at the stats….
There were 6,623 homes sold in 2023, a decrease of 14.8 per cent compared to 2022, and a decline of 23.2 per cent compared to the previous 5-year average for annual sales.
On a monthly basis, there were 285 homes sold in December, a decrease of 0.7 per cent compared to December 2022, and 25.6 per cent below the previous 5-year average for the month.
It should not be a surprise to anyone that for the second year in a row, the housing market in Waterloo Region has been affected by higher interest rates, resulting in a significant decline in annual sales. This year’s sales reached their lowest point in over two decades.
The trend observed in December reflects the overall slowdown in home sales throughout the year, with sales falling behind historical levels. The last time annual sales in Waterloo Region recorded fewer than 7,000 units was the year 2000.
Total residential sales in December included 172 detached (up 3.6 per cent from December 2022), and 54 townhouses (down 6.9 per cent). Sales also included 35 condominium units (up 2.9 per cent) and 24 semi-detached homes (down 4.0 per cent).
For 2023, total residential sales included 3,901 detached (down 17.0 per cent), and 1,339 townhouses (down 6.5 per cent). Sales also included 904 condominium units (down 9.2 per cent) and 457 semi-detached homes (down 26.6 per cent).
In December, the average sale price for all residential properties in Waterloo Region was $740,697. This represents a 2.8 per cent increase compared to December 2022 and a 2.1 per cent decrease compared to November 2023.
- The average price of a detached home was $848,151. This represents a 2.6 per cent increase from December 2022 and a decrease of 4.7 per cent compared to November 2023.
- The average sale price for a townhouse was $617,023. This represents a 0.8 per cent increase from December 2022 and an increase of 1.2 per cent compared to November 2023.
- The average sale price for an apartment-style condominium was $490,816. This represents a 5.0 per cent increase from December 2022 and an increase of 9.0 per cent compared to November 2023.
- The average sale price for a semi was $613,283. This represents a decrease of 0.5 per cent compared to December 2022 and a decrease of 0.5 per cent compared to November 2023.
Average Sale Price – Monthly

On a year-to-date basis, the average sale price for all residential properties in Waterloo Region decreased 7.7 per cent to $786,033 compared to 2022.
- The year-to-date average price of a detached home was $917,907. This represents a 6.1 per cent decrease compared to 2022.
- The year-to-date average sale price for a townhouse was $653,138. This represents a 9.0 per cent decrease compared to 2022.
- The year-to-date average sale price for an apartment-style condominium was $481,877. This represents a 9.0 per cent decrease compared to 2022.
- The year-to-date average sale price for a semi was $677,831. This represents a decrease of 7.9 per cent compared to 2022.
Average Sales Price – Year-to-date
")
| Monthly MLS® Home Price Index Benchmark Price | ||||||
| Kitchener-Waterloo | Cambridge | |||||
| Benchmark Type: | December 2023 | Monthly % Change | Yr./Yr. % Change | December 2023 | Monthly % Change | Yr./Yr. % Change |
| Composite | $705,700 | -0.4 | -1.4 | $706,800 | -2.5 | -0.4 |
| Detached | $798,100 | -0.6 | -0.9 | $727,000 | -2.9 | -0.8 |
| Townhouse | $602,000 | -2.2 | 0.0 | $657,500 | -1.2 | 3.8 |
| Apartment | $471,800 | 3.5 | 2.0 | $497,700 | 1.1 | 1.6 |
| Annual MLS® Home Price Index Benchmark Price | ||||
| Kitchener-Waterloo | Cambridge | |||
| Benchmark Type: | 2023 | Yr./Yr. % Change | 2023 | Yr./Yr. % Change |
| Composite | $746,600 | -9.9 | $753,500 | -9.5 |
| Detached | $848,900 | -8.5 | $784,200 | -9.1 |
| Townhouse | $624,200 | -10.8 | $655,600 | -10.5 |
| Apartment | $475,500 | -8.7 | $485,900 | -11.1 |
")
The region’s slowing housing market echoes the overall slowdown we are seeing in the broader economy.
There were 287 new listings added last month, a decrease of 6.2 per cent compared to December of last year and a 17.9 per cent decrease compared to the previous ten-year average for December.
In 2023, 11,528 new listings were added, a decrease of 14.4 per cent compared to 2022, and a 4.4 per cent decrease compared to the previous ten-year annual average.
The total number of homes available for sale in active status at the end of December was 779, an increase of 36.0 per cent compared to December of last year and 5.8 per cent above the previous ten-year average of 736 listings for December.
The number of months of inventory is up 55.6 per cent compared to December of last year, but still historically low at 1.4 months. Between 2010 and 2015, December’s rolling 12-month average was 3.5 months. The number of months of inventory represents how long it would take to sell off current inventories at the current sales rate.
The average number of days to sell in December was 30, compared to 25 days in December 2022. The previous 5-year average is 23 days.
The average days to sell in 2023 was 19 days, compared to 14 days in 2022 and a previous 5-year average of 18 days.
If you have any questions, wondering what the home down the street sold for or are thinking of making a move in the coming months, feel free to give me a call or text at 519-497-4646 or email Kevinbakerrealestate@gmail.com and we can set up a time to get together for a coffe and discuss your families plans.
Have a great January
Kevin
Average Sales Price – Municipality

Average Sales Price – Township

Monthly Sales By Property Type

Monthly Supply of Homes for Sale

Monthly Median Sales Price – By Property Type

Monthly Average Sales Price – By Property Type

Monthly Average Days on Market
Home Sales Cool in November here in Waterloo Region
I hope you are enjoying the last of the fall weather we are having. Christmas is just around the corner and that means snow as well. As the real estate market here in Waterloo Region almost wraps up another year it looks like things are cooling off once again. Lets take a look at the stats…..In November, there were 441 homes sold, representing a decrease of 4.5 per cent compared to the previous year and a decline of 33.1 per cent compared to the previous 5-year average for the month.Last month, the number of homes sold followed their typical pattern of cooling to match the weather, but with consumer confidence continuing to drop, we saw sales slump to their lowest level for November in over a decade. With many still waiting to see what happens with interest rates in the months to come, homes are taking a little longer to sell, there’s more inventory on the market, all contributing to sale prices levelling off. Total residential sales in November included 266 detached (down 6.7 per cent from November 2022), and 81 townhouses (no change). Sales also included 62 condominium units (up 5.1 per cent) and 31 semi-detached homes (down 16.2 per cent).In November, the average sale price for all residential properties in Waterloo Region was $757,272. This represents a 2.6 per cent increase compared to November 2022 and a 1.4 per cent decrease compared to October 2023.The average price of a detached home was $891,091. This represents a 5.8 per cent increase from November 2022 and on par with October 2023.The average sale price for a townhouse was $611,667. This represents a 1.7 per cent decrease from November 2022 and a decrease of 5.1 per cent compared to October 2023.The average sale price for an apartment-style condominium was $450,476. This represents a decrease of 1.3 per cent from November 2022 and a decrease of 5.4 per cent compared to October 2023.The average sale price for a semi was $617,329. This represents a decrease of 3.9 per cent compared to November 2022 and a decrease of 6.2 per cent compared to October 2023MLS® Home Price Index Benchmark Price Kitchener-WaterlooCambridgeBenchmark Type:November 2023Monthly % ChangeYr./Yr. % ChangeNovember 2023Monthly % ChangeYr./Yr. % ChangeComposite$708,600-2.3-0.6$725,100-3.5-2.1Detached$802,900-2.40.9$748,800-3.9-2.5Townhouse$615,700-1.31.0$665,100-0.93.1Apartment$455,700-2.3-5.2$492,300-1.4-0.9 Canadians are feeling the pinch of affordability, leading to price adjustments in the housing market of Waterloo Region. For prospective homebuyers, this slowdown presents an opportunity to enter the market during a less competitive phase and enjoy the advantages of homeownership in the long run.There were 868 new listings added to the MLS® System in Waterloo Region last month, an increase of 15 per cent compared to November last year and a 16.7 per cent increase compared to the previous ten-year average for November.The total number of homes available for sale in active status at the end of November was 1,305 an increase of 54.8 per cent compared to November of last year and 21.0 per cent above the previous ten-year average of 1079 listings for November.There were 2.4 months of inventory at the end of November, an 84.6 per cent increase compared to last year and 50.9 per cent above the previous 10-year average. The number of months of inventory represents how long it would take to sell off current inventories at the current sales rate. The average number of days to sell in November was 24, compared to 22 days in November 2022. The previous 5-year average is 20 days. As always if you have any questions at all, want to know what a neighbors home sold for or are thinking of making a move this winter, please give me a call or text to 519-497-4646 or email to Kevinbakerrealestate@gmail.com and we can sit down for a coffee and chat about your plans. Have a Wonderful December!Kevin Canadians are feeling the pinch of affordability, leading to price adjustments in the housing market of Waterloo Region. For prospective homebuyers, this slowdown presents an opportunity to enter the market during a less competitive phase and enjoy the advantages of homeownership in the long run.There were 868 new listings added to the MLS® System in Waterloo Region last month, an increase of 15 per cent compared to November last year and a 16.7 per cent increase compared to the previous ten-year average for November.The total number of homes available for sale in active status at the end of November was 1,305 an increase of 54.8 per cent compared to November of last year and 21.0 per cent above the previous ten-year average of 1079 listings for November.There were 2.4 months of inventory at the end of November, an 84.6 per cent increase compared to last year and 50.9 per cent above the previous 10-year average. The number of months of inventory represents how long it would take to sell off current inventories at the current sales rate. The average number of days to sell in November was 24, compared to 22 days in November 2022. The previous 5-year average is 20 days. As always if you have any questions at all, want to know what a neighbors home sold for or are thinking of making a move this winter, please give me a call or text to 519-497-4646 or email to Kevinbakerrealestate@gmail.com and we can sit down for a coffee and chat about your plans. Have a Wonderful December!KevinAverage Sales Price –MunicipalityAverage Sales Price – TownshipMonthly Sales By Property TypeMonthly Supply of Homes for SaleMonthly Median Sales Price – By Property TypeMonthly Average Sales Price – By Property TypeMonthly Average Days on Market |
October Sales Pick Up Slightly in Waterloo Region
I hope you had a great Halloween with all the Trick or Treater’s and have been enjoying the nice weather we have had over the past few weeks.
The stats are out for October, there were 559 homes sold representing an increase of 12.2 per cent compared to the previous year and a decline of 24.4 per cent compared to the previous 5-year average for the month.
Homes sales in the Waterloo Region were up over last October’s record low but are still subdued, with the Bank of Canada holding its policy rate at 5 per cent, and I will be watching to see what the Bank of Canada does at their next scheduled announcement on December 6, 2023.
Total residential sales in October included 329 detached (up 6.1 per cent from October 2022), and 129 townhouses (up 51.8 per cent). Sales also included 64 condominium units (down 3.0 per cent) and 32 semi-detached homes (no change).
In October, the average sale price for all residential properties in Waterloo Region was $767,848. This represents a 0.6 per cent increase compared to October 2022 and a 0.1 per cent increase compared to September 2023.
- The average price of a detached home was $890,591. This represents a 1.1 per cent increase from October 2022 and an increase of 0.1 per cent compared to September 2023.
- The average sale price for a townhouse was $644,511. This represents a 1.4 per cent increase from October 2022 and an increase of 0.7 per cent compared to September 2023.
- The average sale price for an apartment-style condominium was $476,166. This represents a decrease of 2.6 per cent from October 2022 and a decrease of 4.8 per cent compared to September 2023.
- The average sale price for a semi was $658,133. This represents an increase of 5.7 per cent compared to October 2022 and a decrease of 2.4 per cent compared to September 2023.

| MLS® Home Price Index Benchmark Price | ||||||
| Kitchener-Waterloo | Cambridge | |||||
| Benchmark Type: | October 2023 | Monthly % Change | Yr./Yr. % Change | October 2023 | Monthly % Change | Yr./Yr. % Change |
| Composite | $725,100 | -1.3 | -0.1 | $751,100 | 1.3 | 3.3 |
| Detached | $822,900 | -1.2 | 1.2 | $779,300 | 1.7 | 4.0 |
| Townhouse | $623,500 | -1.1 | 2.0 | $670,800 | -1.0 | 2.2 |
| Apartment | $466,600 | -1.8 | -3.6 | $499,200 | -0.5 | -2.5 |

While sales are down, we are seeing an increase in the number of homes available for sale, which is good news for buyers. However many prospective buyers have been sidelined by higher borrowing costs and selling prices that continue to demonstrate resilience.
There were 1,133 new listings added last month, an increase of 36.0 per cent compared to October last year and a 20.2 per cent increase compared to the previous ten-year average for October.
The total number of homes available for sale in active status at the end of October was 1,408, an increase of 53.4 per cent compared to October of last year and 13.0 per cent above the previous ten-year average of 1247 listings for October.
There were 2.5 months of inventory at the end of October, a 92.3 per cent increase compared to last year and 35.1 per cent above the previous 10-year average. The number of months of inventory represents how long it would take to sell off current inventories at the current sales rate.
The average number of days to sell in October was 21, compared to 22 days in October 2022. The previous 5-year average is 19 days.
Average Sales Price – Municipality

Average Sales Price – Township

Monthly Sales By Property Type

Monthly Supply of Homes for Sale

Monthly Median Sales Price – By Property Type

Monthly Average Sales Price – By Property Type

Monthly Average Days on Market
If you are thinking of buying or selling before christmas, wondering what your neighbor’s home sold for, or have any questions at all, give me a call or text at 519-497-4646 or shoot me an email at kevinbakerrealestate@gmail.com
Have a great November!
Kevin
