
Declining Sales and Increased inventory was the trend for 2026 in Waterloo Region Housing Market
I hope you are having a wonderful holiday season with your families. I myself ate a little too much but really enjoyed getting together with family and friends over Christmas and New Years.
Now that 2026 has started, the kids are back to school, I notice the gym is a little busier each day that I am there but that’s great, hopefully everyone can keep their new years resolutions!
The stats are out for last year for the real estate market so lets take a look…
There were 6,177 homes sold in Waterloo Region in 2025, a decrease of 8.8 per cent compared to 2024, and a 25.3 per cent compared to the previous ten-year average for annual sales.
On a monthly basis, 306 homes were sold in December, a decrease of 9.5 per cent compared to the same period last year and a decrease of nearly 19.5 per cent compared to the average number of homes sold in the previous ten years for the same month.
In Waterloo Region, we observed an increase in new listings coming onto the market in 2025, accompanied by softening sales and longer selling times. This trend occurred during a year when affordability remained a challenge for many aspiring homebuyers, as global and economic uncertainty contributed to a weaker housing market. With the downward pressure on housing prices, and more options for buyers, it proved to be a good year for those first-time buyers who were able to get into the market.
Total residential sales in December included 192 detached homes (no change from December 2024), and 52 townhouses (down 39.1 per cent). Sales also included 35 condominium units (down 14.6 per cent) and 26 semi-detached homes (up 23.8 per cent).
For 2025, total residential sales included 3,779 detached (down 7.7 per cent), and 1,174 townhouses (down 14.4 per cent). Sales also included 727 condominium units (down 11.6 per cent) and 484 semi-detached homes (up 1.5 per cent).
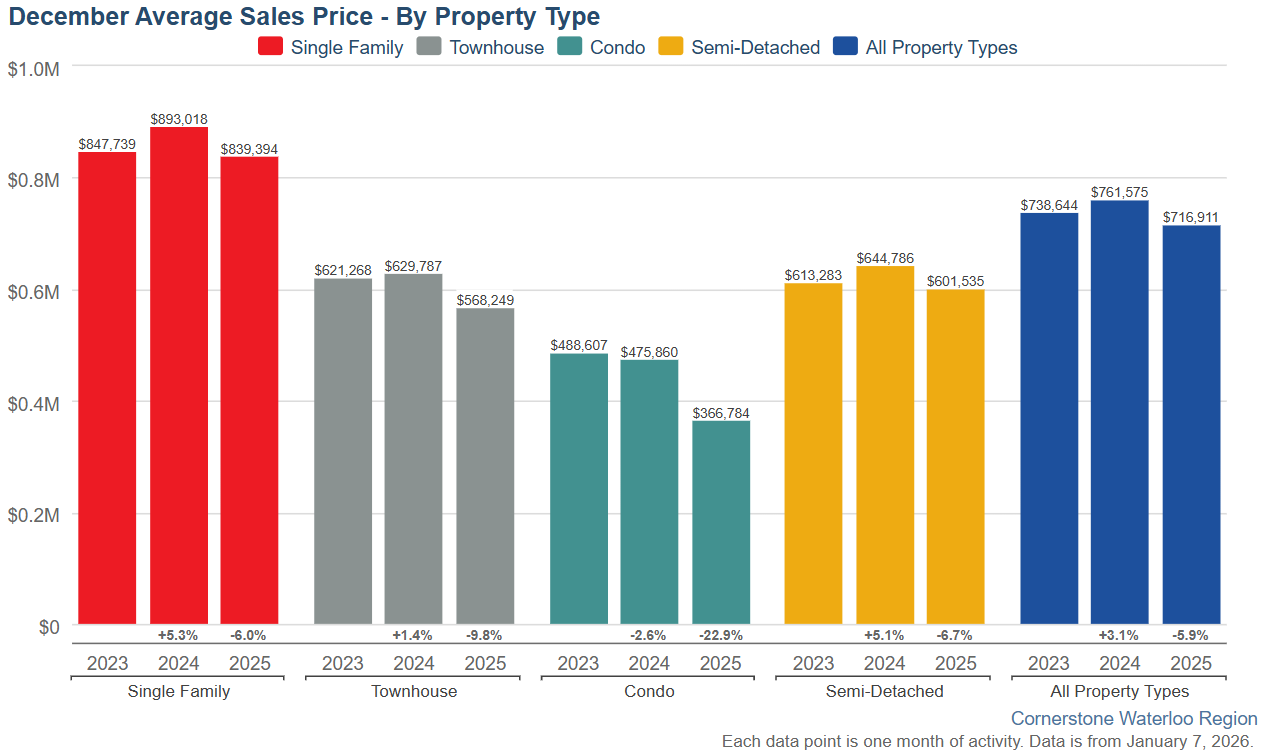
In December, the average sale price for all residential properties in Waterloo Region was $716,911. This represents a 5.9 per cent decrease compared to December 2024 and a 0.5 per cent increase compared to November 2025.
- The average sale price of a detached home was $839,394. This represents a 6.0 per cent decrease from December 2024 and an increase of 1.4 per cent compared to November 2025.
- The average sale price for a townhouse was $568,249. This represents a 9.8 per cent decrease from December 2024 and a decrease of 4.4 per cent compared to November 2025.
- The average sale price for an apartment-style condominium was $366,784. This represents a 22.9 per cent decrease from December 2024 and a decrease of 13.1 per cent compared to November 2025.
- The average sale price for a semi was $601,535. This represents a decrease of 6.7 per cent compared to December 2024 and a decrease of 5.6 per cent compared to November 2025.
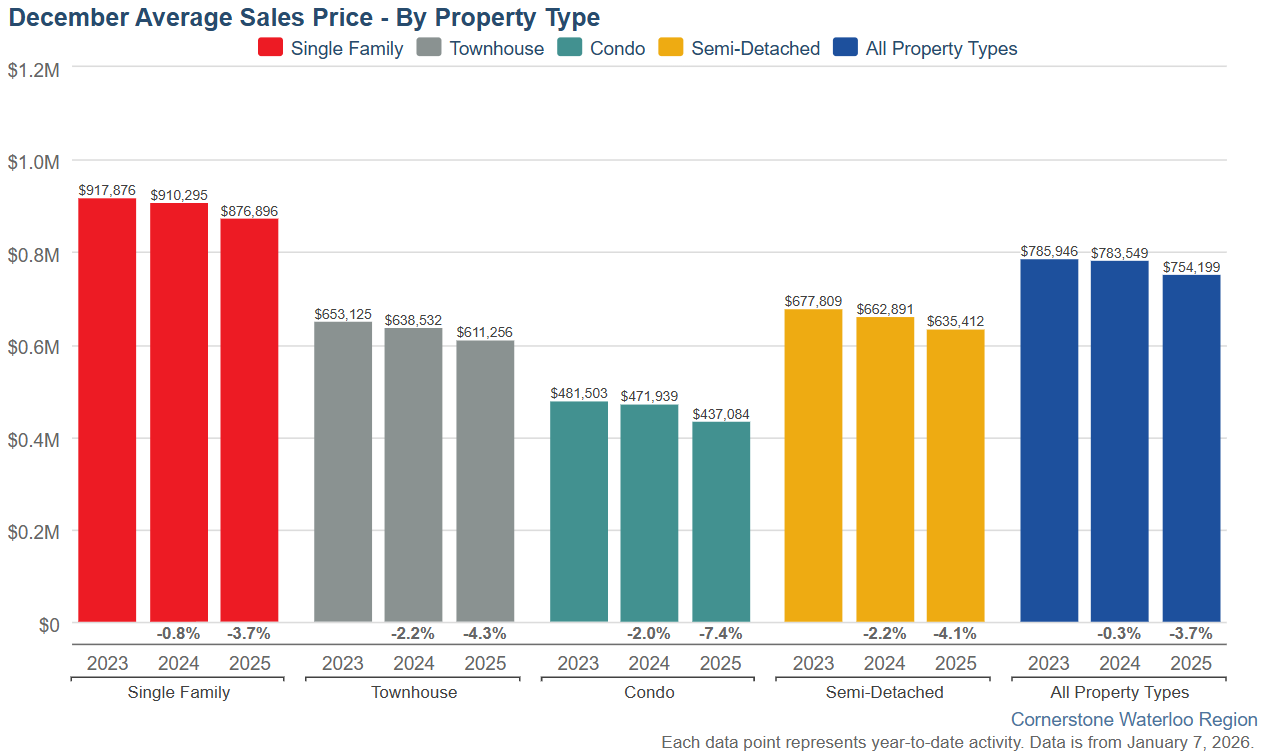
Year-to-date, the average sale price for all residential properties in Waterloo Region decreased 3.7 per cent to $754,199 compared to 2024.
- The year-to-date average price of a detached home was $876,896. This represents a 3.7 per cent decrease compared to 2024.
- The year-to-date average sale price for a townhouse was $611,256. This represents a 4.3 per cent decrease compared to 2024.
- The year-to-date average sale price for an apartment-style condominium was $437,084. This represents a 7.4 per cent decrease compared to 2024.
- The year-to-date average sale price for a semi was $635,412. This represents a decrease of 4.1 per cent compared to 2024.
| Monthly MLS® Home Price Index Benchmark Price (HPI) | ||||||
| Kitchener-Waterloo | Cambridge | |||||
| Benchmark Type: | December 2025 | Monthly % Change | Yr./Yr. % Change | December 2025 | Monthly % Change | Yr./Yr. % Change |
| Composite | $640,100 | -0.4 | -8.8 | $674,300 | -1.6 | -6.1 |
| Single Family | $752,200 | -0.3 | -8.1 | $714,100 | -2.0 | -5.8 |
| Townhouse | $527,600 | -0.6 | -8.8 | $597,100 | -0.4 | -4.5 |
| Apartment | $392,000 | -0.9 | -11.6 | $430,600 | -1.3 | -8.3 |
| Annual MLS® Home Price Index Benchmark Price | ||||
| Kitchener-Waterloo | Cambridge | |||
| Benchmark Type: | 2025 | Yr./Yr. % Change | 2025 | Yr./Yr. % Change |
| Composite | $679,600 | -5.4% | $712,200 | -4.0% |
| Detached | $799,800 | -5.1% | $756,300 | -3.4% |
| Townhouse | $554,400 | -6.3% | $617,500 | -4.0% |
| Apartment | $415,500 | -7.50% | $451,600 | -5.9% |

There were 375 new listings added last month, an increase of 6.5 per cent compared to December last year, and an 11.3 per cent increase compared to the previous ten-year average for December.
In 2025, 13,872 new listings were added, an increase of 5.2 per cent compared to 2024, and a 15.7 per cent increase compared to the previous ten-year annual average.
At the end of December, there were 1,188 homes available for sale in active status, representing a 15.9% increase from the same month last year. This number surpasses the previous ten-year average of 595 homes in December.
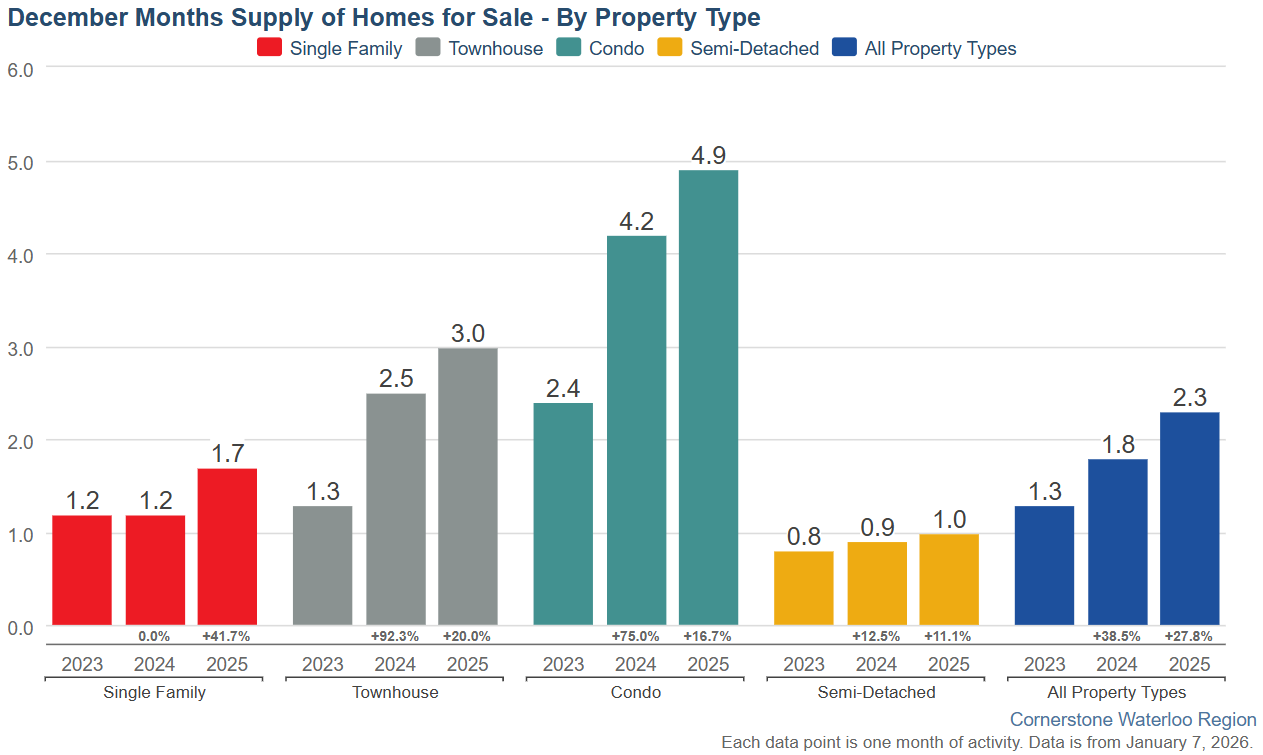
The total inventory across the market increased by 27.8 percent, resulting in a 2.3-month supply of all property types by the end of December. Condominium apartments had the highest inventory, with 4.9 months’ supply, followed by townhouses with 3.0 months’ supply and detached homes with 1.7 months’ supply. The number of months of inventory represents the time it would take to sell all current inventories at the current sales rate.
The average time to sell a home in December was 45 days, which is 6 days longer than the previous month. In December 2024, it took 36 days for a home to sell, and the five-year average was 24 days.
Average Sales Price – Municipality
Average Sales Price – Township
Monthly Sales By Property Type
Monthly Supply of Homes for Sale
Monthly Median Sales Price – By Property Type
Monthly Average Sales Price – By Property Type
Monthly Average Days on Market
Monthly Number of New Listings – By Property Type
Monthly Homes for Sale
Monthly Supply of Homes for Sale – By Property Type
If you have any questions at all, are thinking of making a move this winter into spring, or are wondering what your home might be worth, give me a call or text to 519-497-4646 or shoot me an email to kevinbakerrealestate@gmail.com and we can sit down for a coffee and chat about your family’s needs going forward.
Have a great weekend!
Kevin
Waterloo Region Housing stats showing a more balanced market in June
I hope you had a wonderful Canada Day! The weather lately has been great, a little hot for my liking but certainly a good reason to get outside and enjoy it.
The stats are out for June and things are looking more balanced in the Waterloo Region Real estate market. Let’s take a look…
In June, a total of 676 homes were sold. This represents a 0.3 per cent increase compared to the same period last year and a decline of 21.7 per cent compared to the average number of homes sold in the previous ten years for the same month.
While home sales in June were relatively stable year-over-year, we’re seeing a more balanced market emerge in Waterloo Region. What’s particularly notable is the increase in condominium sales – up over 34% – suggesting a lot of buyers are looking for more affordable housing options.. While more listings are coming to market, properties are taking a little longer to sell, giving buyers more time to make informed decisions during their home search.
Total residential sales in June included 442 detached homes (up 5.6 per cent from June 2024), and 113 townhouses (down 17.4 per cent). Sales also included 86 condominium units (up 34.4 per cent) and 35 semi-detached homes (down 25.4 per cent).
In June, the average sale price for all residential properties in Waterloo Region was $780,293. This represents a 1.1 per cent decrease compared to June 2024 and a 1.2 per cent decrease compared to May 2025.
- The average price of a detached home was $896,770. This represents a 0.2 per cent decrease from June 2024 and a decrease of 1.4 per cent compared to May 2025.
- The average sale price for a townhouse was $624,754. This represents a 6.0 percent decrease from June 2024 and a 1.6 percent decrease compared to May 2025.
- The average sale price for an apartment-style condominium was $435,435. This represents a 5.7 per cent decrease from June 2024 and an increase of 0.7 per cent compared to May 2025.
- The average sale price for a semi was $649,039, on par with June 2024 and a 0.5 per cent decrease compared to May 2025.
| MLS® Home Price Index Benchmark Price (HPI) | ||||||
| Kitchener-Waterloo | Cambridge | |||||
| Benchmark Type: | June 2025 | Monthly % Change | Yr./Yr. % Change | June 2025 | Monthly % Change | Yr./Yr. % Change |
| Composite | $686,100 | -2.3 | -7.5 | $723,400 | -1.5 | -4.2 |
| Single Family | $805,600 | -2.7 | -5.5 | $767,300 | -1.5 | -3.1 |
| Townhouse | $568,200 | -2.7 | -9.3 | $623,400 | -1.5 | -4.5 |
| Apartment | $417,900 | 1.5 | -8.3 | $458,200 | -0.8 | -6.6 |

There were 1,514 new listings added last month, an increase 5.3 per cent compared to June last year and a 15.1 percent increase compared to the previous ten-year average for June.
The average time to sell a home in June was 27 days, compared to 24 days in the previous month. In June 2024, it took 18 days for a home to sell, and the five-year average was 15 days.
If you have any questions at all, are thinking of making a move this summer or are wondering what your home might be worth, give me a call or text to 519-497-4646 or shoot me an email to kevinbakerrealestate@gmail.com and we can sit down for a coffee and chat about your family’s needs going forward.
Have a great rest of July!
Kevin
Inventory levels still growing and Sales are slowing here in Waetrloo Region
I hope you are having a great June so far. The nice weather is finally here and all the gardeners are loving it. The Real Estate Market here in Waterloo Region has been pretty sluggish over the past year and most notably this spring but I have noticed in the last week or two the showing activity has picked up on residential homes. The condo market is still saturated with inventory and not selling through well but prices seem to remain steady. Lets take a look at the stats for may….
In May, a total of 675 homes were sold, this represents a 9.3 per cent decrease compared to the same period last year and a decline of 26.2 per cent compared to the average number of homes sold in the previous ten years for the same month.
Total residential sales in May included 427 detached homes (down 8.4 per cent from May 2024), and 132 townhouses (down 1.5 per cent). Sales also included 67 condominium units (down 20.2 per cent) and 48 semi-detached homes (down 18.6 per cent).
In May, the average sale price for all residential properties in Waterloo Region was $789,154. This represents a 3.6 per cent decrease compared to May 2024 and a 0.8 per cent increase compared to April 2025.
- The average price of a detached home was $909,897. This represents a 3.7 percent decrease from May 2024 and a decrease of 1.0 per cent compared to April 2025.
- The average sale price for a townhouse was $634,320. This represents a 3.5 per cent decrease from May 2024 and an increase of 3.1 per cent compared to April 2025.
- The average sale price for an apartment-style condominium was $431,944. This represents a 6.7 percent decrease from May 2024 and a decrease of 9.4 per cent compared to April 2025.
- The average sale price for a semi was $652,627. This represents a decrease of 6.7 per cent compared to May 2024 and a decrease of 1.4 per cent compared to April 2025.
| MLS® Home Price Index Benchmark Price (HPI) | ||||||
| Kitchener-Waterloo | Cambridge | |||||
| Benchmark Type: | May 2025 | Monthly % Change | Yr./Yr. % Change | May 2025 | Monthly % Change | Yr./Yr. % Change |
| Composite | $702,400 | 0.6 | -6.6 | $734,300 | 1.0 | -3.4 |
| Single Family | $828,300 | 1.1 | -4.5 | $778,700 | 0.7 | -2.2 |
| Townhouse | $584,000 | -0.3 | -7.9 | $663,100 | 0.8 | -3.7 |
| Apartment | $411,600 | -6.7 | -10.2 | $462,100 | -2.0 | -6.8 |

Right now, we’re seeing a market that is different from the frenzied market of a few years ago, but that’s a good thing for buyers who have more breathing room to make decisions. The fundamentals that make Waterloo Region attractive – our diverse economy, strong tech sector, world-class educational institutes and stable governance – continue to strengthen. Waterloo Region has proven time and again that it is a solid place to invest and put down roots.
There were 1,663 new listings added last month, an increase 1.4 percent compared to May last year and a 15.6 percent increase compared to the previous ten-year average for May.
The average time to sell a home in May was 24 days, which was the same in the previous month. In May 2024, it took 16 days for a home to sell, and the five-year average was 14 days.
If you have any questions at all, are thinking of making a move this summer or are wondering what your home might be worth, give me a call or text to 519-497-4646 or shoot me an email to kevinbakerrealestate@gmail.com and we can sit down for a coffee and chat about your family’s needs going forward.
Have a great Fathers day next weekend to all the dads out there.
Kevin
The Real Estate Market is Shifting Here in Waterloo Region.
I hope you are having a great May so far. Looks like spring is hopefully here to stay, after this crazy winter and early spring weather we have been having. The numbers are out for Waterloo Region’s Real Estate market and we are certainly in a different environment than we have been used to for the past many years. Let’s break down the numbers and have a look….
In April, a total of 595 homes were sold in the Waterloo Region. This represents a 14.1 percent decrease compared to the same period last year and a decline of 26.7 percent compared to the average number of homes sold in the previous ten years for the same month.
Home sales in April showed typical seasonal improvement over March, but have remained notably below the ten-year average. What we’re seeing is a clear market rebalancing, with inventory levels up 75% above the ten-year average and nearly four months of supply across all property types. This shift is creating more opportunities for buyers who now have more time for due diligence and negotiations, while sellers are adapting to a market that demands strategic pricing and patience.
Total residential sales in April included 356 detached homes (down 12.5 per cent from April 2024), and 109 townhouses (down 19.9 per cent). Sales also included 71 condominium units (down 22.8 per cent) and 59 semi-detached homes (up 5.4 per cent).
In April, the average sale price for all residential properties in Waterloo Region was $789,639. This represents a 1.7 percent decrease compared to April 2024 and a 2.7 per cent increase compared to March 2025.
- The average price of a detached home was $927,591.?This represents a 1.7 percent decrease from April 2024 and an increase of 0.9 per cent compared to March 2025.
- The average sale price for a townhouse was $615,982. This represents a 7.0 percent decrease from April 2024 and a decrease of 0.2 per cent compared to March 2025.
- The average sale price for an apartment-style condominium was $473,079.?This is on par with April 2024 and an increase of 3.5 per cent compared to March 2025.
- The average sale price for a semi was $659,017. This represents a decrease of 0.7 per cent compared to April 2024 and a decrease of 0.6 per cent compared to March 2025.
Average Sale Price – Monthly

| MLS® Home Price Index Benchmark Price (HPI) | ||||||
| Kitchener-Waterloo | Cambridge | |||||
| Benchmark Type: | April 2025 | Monthly % Change | Yr./Yr. % Change | April 2025 | Monthly % Change | Yr./Yr. % Change |
| Composite | $703,500 | -3.5 | -6.1 | $730,400 | -1.4 | -3.4 |
| Single Family | $821,100 | -2.6 | -5.2 | $773,600 | -0.8 | -2.1 |
| Townhouse | $582,300 | -2.7 | -7.1 | $626,800 | -0.6 | -4.7 |
| Apartment | $441,200 | 1.6 | -3.2 | $471,800 | -2.3 | -6.4 |

There were 1,371 new listings added last month, a decrease of 4.9 percent compared to April last year and a 10.5 percent increase compared to the previous ten-year average for April.
The total number of homes available for sale in active status at the end of April was 1,936, an increase of 39.5 percent compared to April of last year and 75.3 percent above the previous ten-year average of 1,105 listings for April.
The total inventory across the market increased by 52.0 percent, resulting in a 3.8-month supply of all property types by the end of April. Condominium apartments had the highest inventory, with 8.0 months’ supply, followed by townhouses with 4.9 months’ supply and detached homes with 2.89 months’ supply. The number of months of inventory represents the time it would take to sell all current inventories at the current sales rate.
The average time to sell a home in April was 20 days, compared to 24 days in the previous month. In April 2024, it took 15 days for a home to sell, and the five-year average was 14 days.
Average Sales Price – Municipality

Average Sales Price – Township

Monthly Sales By Property Type

Monthly Supply of Homes for Sale

Monthly Supply of Homes for Sale – By Property Type

Monthly Median Sales Price – By Property Type

Monthly Average Sales Price – By Property Type

Monthly Average Days on Market

If you have any questions at all, are thinking of making a move this spring/summer or are wondering what your home might be worth, give me a call or text to 519-497-4646 or shoot me an email to kevinbakerrealestate@gmail.com and we can sit down for a coffee and chat about your family’s needs going forward.
Have a great Mother’s Day to all the mom’s out there.
Kevin
Home Sales Cool in March with inventory levels reaching 9 year highs
I hope you are having a great April so far. Looks like the spring is hopefully here after that crazy weather we had on wednesday and that means an increase in activity in the Kitchener Waterloo Real Estate Market. Let’s take a look at the stats from March
In March, a total of 459 homes were sold in the Waterloo Region. This represents a 23.1 percent decrease compared to the same period last year and a decline of 45.2 percent compared to the average number of homes sold in the previous ten years for the same month.
March’s housing market shows a significant shift from last year’s dynamics, with sales activity cooling while inventory levels have reached their highest point for March since 2015. This changing landscape is providing buyers with more options and time to make informed decisions.
Total residential sales in March included 259 detached homes (down 24.7 percent from March 2024), and 98 townhouses (down 24.0 per cent). Sales also included 60 condominium units (down 29.4 per cent) and 40 semi-detached homes (up 8.1 per cent).
In March, the average sale price for all residential properties in Waterloo Region was $771,915. This represents a 4.4 per cent decrease compared to March 2024 and a 0.5 per cent increase compared to February 2025.
- The average price of a detached home was $921,985. This represents a 3.6 percent decrease from March 2024 and an increase of 2.3 per cent compared to February 2025.
- The average sale price for a townhouse was $622,231. This represents a 6.6 percent decrease from March 2024 and an increase of 1.2 per cent compared to February 2025.
- The average sale price for an apartment-style condominium was $457,925. This represents a 5.5 percent decrease from March 2024 and an increase of 4.8 per cent compared to February 2025.
- The average sale price for a semi was $663,145. This represents a decrease of 2.5 per cent compared to March 2024 and a decrease of 1.1 per cent compared to February 2025.
Average Sale Price – Monthly

| MLS® Home Price Index Benchmark Price (HPI) | ||||||
| Kitchener-Waterloo | Cambridge | |||||
| Benchmark Type: | March 2025 | Monthly % Change | Yr./Yr. % Change | March 2025 | Monthly % Change | Yr./Yr. % Change |
| Composite | $728,800 | -0.2 | -2.7 | $740,900 | -1.4 | -1.9 |
| Single Family | $843,300 | 0.3 | -2.5 | $779,500 | -1.6 | -1.3 |
| Townhouse | $598,300 | -0.3 | -3.4 | $630,600 | 0.2 | -3.2 |
| Apartment | $434,200 | -1.4 | -6.7 | $482,800 | -0.3 | -3.5 |

While both average prices and the HPI declined on a year-over-year basis, we’re seeing month-over-month price stability in most housing categories. The increased inventory, now at a 3.2-month supply, is creating a more balanced market environment compared to the tight conditions we’ve experienced over the past many years. This shift is particularly evident in the condominium segment, where we now have nearly seven months of inventory available.
There were 1,180 new listings added last month, an increase of 15.5 per cent compared to March last year and a 2.4 per cent decrease compared to the previous ten-year average for March.
The total number of homes available for sale in active status at the end of March was 1,700, an increase of 58.4 per cent compared to March of last year and 72.9 per cent above the previous ten-year average of 983 listings for March.
The total inventory across the market increased by 68.4 percent, resulting in a 3.2-month supply of all property types by the end of March. Condominium apartments had the highest inventory, with 6.9 months’ supply, followed by townhouses with 4.2 months’ supply and detached homes with 2.3 months’ supply. The number of months of inventory represents the time it would take to sell all current inventories at the current sales rate.
The average time to sell a home in March was 28 days, compared to 24 days in the previous month. In March 2024, it took 19 days for a home to sell, and the five-year average was 14 days.
Average Sales Price – Municipality

Average Sales Price – Township

Monthly Sales By Property Type

Monthly Supply of Homes for Sale

Monthly Supply of Homes for Sale – By Property Type

Monthly Median Sales Price – By Property Type

Monthly Average Sales Price – By Property Type

Monthly Average Days on Market

If you have any questions at all, are thinking of making a move this spring or are wondering what your home might be worth, give me a call or text to 519-497-4646 or shoot me an email to kevinbakerrealestate@gmail.com and we can sit down for a coffee and chat about your family’s needs going forward.
Have a great rest of your weekend!
Kevin
New Listings up, sales down but prices remain stable in Waterloo Region
I hope you are having a great March so far. Looks like the spring thaw is fast approaching and that means an increase in activity in the Kitchener Waterloo Real Estate Market. Let’s take a look at the stats from February….
In February, a total of 363 homes were sold. This represents a 26.1 percent decrease compared to the same period last year and a decline of 38.8 percent compared to the average number of homes sold in the previous ten years for the same month.
While February’s home sales were affected by concerns over tariffs and their potential impact on employment, the market showed some encouraging signs. We saw a steady increase in new listings while prices remained stable. The month’s significant snowfall created practical challenges for buyers and sellers, affecting property viewings and transactions. However, I am seeing positive indicators in the market, with consistent attendance at open houses, pre-listing appointments, steady mortgage pre-approvals, and buyers on the sidelines carefully watching for the right opportunity to make their move.
Total residential sales in February included 221 detached homes (down 21.9 percent from February 2024), and 71 townhouses (down 36.0 percent). Sales also included 47 condominium units (down 35.6 percent) and 23 semi-detached homes (down 4.2 percent).
In February, the average sale price for all residential properties in Waterloo Region was $767,800. This represents a 1.3 percent increase compared to February 2024 and a 1.8 per cent increase compared to January 2025.
- The average price of a detached home was $900,003. This represents a 1.0 per cent increase from February 2024 and an increase of 2.1 per cent compared to January 2025.
- The average sale price for a townhouse was $613,924. This represents a 2.7 percent decrease from February 2024 and a decrease of 2.6 per cent compared to January 2025.
- The average sale price for an apartment-style condominium was $437,000. This represents a 5.8 percent decrease from February 2024 and a decrease of 7.2 per cent compared to January 2025.
- The average sale price for a semi was $670,352. This represents a decrease of 0.5 percent compared to February 2024 and an increase of 6.6 percent compared to January 2025.
Average Sale Price – Monthly

| MLS® Home Price Index Benchmark Price | ||||||
| Kitchener-Waterloo | Cambridge | |||||
| Benchmark Type: | February 2025 | Monthly % Change | Yr./Yr. % Change | February 2025 | Monthly % Change | Yr./Yr. % Change |
| Composite | $729,900 | 0.0 | -0.9 | $751,300 | 0.6 | 0.6 |
| Single Family | $841,000 | -0.8 | -1.1 | $792,100 | 0.6 | 1.6 |
| Townhouse | $600,200 | 1.7 | -1.8 | $629,300 | 0.5 | -2.1 |
| Apartment | $440,400 | 2.3 | -1.9 | $484,500 | 1.1 | -2.2 |

As we navigate these shifting dynamics in the Waterloo Region housing market, it’s important to remember that while sales may be down, the increase in inventory reflects growing opportunities for buyers. Now is a great time for buyers to get out and start looking for a new home.
There were 858 new listings added last month, an increase of 7.3 percent compared to February last year and a 0.8 percent increase compared to the previous ten-year average for February.
The total number of homes available for sale in active status at the end of February was 1,450, an increase of 55.7 percent compared to February of last year and 68.7 percent above the previous ten-year average of 860 listings for February.
The total inventory across the market increased by 52.9 percent, resulting in a 2.6-month supply of all property types by the end of February. Condominium apartments had the highest inventory, with 5.9 months’ supply, followed by townhouses with 3.6 months’ supply and detached homes with 1.8 months’ supply. The number of months of inventory represents the time it would take to sell off current inventories at the current sales rate.
The average time to sell a home in February was 24 days, compared to 34 days in the previous month. Likewise, in February 2024, it took 24 days for a home to sell, and the five-year average was 15 days.
If you have any questions at all, are thinking of making a move this spring or are wondering what your home might be worth, give me a call or text to 519-497-4646 or shoot me an email to kevinbakerrealestate@gmail.com and we can sit down for a coffee and chat about your family’s needs going forward.
Have a great rest of your week!
Kevin
Average Sales Price – Municipality

Average Sales Price – Township

Monthly Sales By Property Type

Monthly Supply of Homes for Sale

Monthly Supply of Homes for Sale – By Property Type

Monthly Median Sales Price – By Property Type

Monthly Average Sales Price – By Property Type

Monthly Average Days on Market

January 2025 Real Estate update for Kitchener, Waterloo and Cambridge
I hope you are having a great winter so far. The weather sure has been cold so hopefully you have been able to get out and enjoy some skiing or even a trip down south to enjoy some warmer weather.
The stats are out for January and things are remaining steady in the Waterloo Region Real Estate market. Listings are up, sales and prices are down slightly, so that is giving the buyers who are out there plenty of choice when looking for their next home. Let’s take a look at the numbers…
In January, a total of 329 homes were sold in the Waterloo Region. This represents a 12.0 per cent decrease compared to the same period last year and a decline of 18.6 per cent compared to the average number of homes sold in the previous ten years for the same month.
The Waterloo Region’s housing market shows promising dynamics as we begin 2025. With nearly 50 percent more active listings compared to last January and inventory levels well above the ten-year average, we’re seeing more choices for buyers in the market. While sales have softened compared to last year, the increased inventory levels are creating more balanced conditions between buyers and sellers.
Total residential sales in January included 188 detached homes (down 10.5 per cent from January 2024), and 81 townhouses (down 8.0 per cent). Sales also included 39 condominium units (down 30.4 per cent) and 21 semi-detached homes (up 5.0 per cent).
In January, the average sale price for all residential properties in Waterloo Region was $755,859. This represents a 1.0 per cent decrease compared to January 2024 and a 0.6 per cent decrease compared to December 2024.
- The average price of a detached home was $882,941. This represents a 3.1 per cent decrease from January 2024 and a decrease of 1.2 per cent compared to December 2024.
- The average sale price for a townhouse was $630,116. This represents a 1.1 per cent decrease from January 2024 and an increase of 0.1 per cent compared to December 2024.
- The average sale price for an apartment-style condominium was $469,623. This represents a 4.6 per cent increase from January 2024 and a decrease of 1.2 per cent compared to December 2024.
- The average sale price for a semi was $634,762. This represents a decrease of 1.9 per cent compared to January 2024 and a decrease of 1.6 per cent compared to December 2024.
Average Sale Price – Monthly

| MLS® Home Price Index Benchmark Price | ||||||
| Kitchener-Waterloo | Cambridge | |||||
| Benchmark Type: | January 2025 | Monthly % Change | Yr./Yr. % Change | January 2025 | Monthly % Change | Yr./Yr. % Change |
| Composite | $730,000 | 1.8 | 0.6 | $747,300 | 3.1 | 0.0 |
| Single Family | $847,500 | 3.1 | 1.5 | $787,400 | 3.8 | 1.2 |
| Townhouse | $590,100 | -1.5 | -2.0 | $626,400 | -0.6 | -3.9 |
| Apartment | $430,600 | -3.4 | -4.2 | $479,600 | 0.2 | -2.3 |

In an expected move, the Bank of Canada lowered its policy rate by 25 basis points to 3 per cent on January 29, 2025, helping to bring down the cost of borrowing. This reduction was welcome news for potential homebuyers, however, with a potential trade war with the U.S. still looming, it’s difficult to predict what will happen when the Bank makes its next interest rate announcement on March 12.
While the current economic uncertainty might make some house hunters hesitant, with the new mortgage reforms that took effect in December. These changes make it easier to qualify for a mortgage with a down payment of less than 20 percent. Additionally, the insured mortgage cap increased from $1 million to $1.5 million, and all first-time buyers and those purchasing new builds will be eligible for 30-year amortizations, which will help reduce monthly payments.
There were 901 new listings added in Waterloo Region last month, an increase of 25.0 per cent compared to January last year and a 27.6 per cent increase compared to the previous ten-year average for January.
The total number of homes available for sale in active status at the end of January was 1,296 an increase of 49.5 per cent compared to January of last year and 71.5 per cent above the previous ten-year average of 992 listings for January.
The total inventory across the market increased by 43.8 percent, resulting in a 2.3-month supply of all property types by the end of January. Condominium apartments had the highest inventory, with 5.1 months’ supply, followed by townhouses with 3.5 months’ supply and detached homes with 1.5 months’ supply. The number of months of inventory represents the time it would take to sell off current inventories at the current sales rate.
The average time to sell a home in January was 33 days, compared to 37 days in the previous month. In January 2024, it took 32 days for a home to sell, and the five-year average was 21 days.
If you have any questions at all, are thinking of making a move this spring or are wondering what your home might be worth, give me a call or text to 519-497-4646 or shoot me an email to kevinbakerrealestate@gmail.com and we can sit down for a coffee and chat about your family’s needs going forward.
Have a great rest of your week!
Kevin
Average Sales Price – Municipality

Average Sales Price – Township

Monthly Sales By Property Type

Monthly Supply of Homes for Sale

Monthly Supply of Homes for Sale – By Property Type

Monthly Median Sales Price – By Property Type

Monthly Average Sales Price – By Property Type

Monthly Average Days on Market

Waterloo Home Sales Show Slight Growth in 2024
Happy New Year! I hope you had a wonderful holiday season with your families and 2025 is off to a great start! With the arrival of snow, it looks like winter is finally here.
The stats are out for 2024 and it was a decent year for real estate sales here in Waterloo Region.
There were 6,777 homes sold in 2024, an increase of 2.8 per cent compared to 2023, and a decline of 18.9 per cent compared to the previous 5-year average for annual sales.
On a monthly basis, 334 homes were sold in December, an increase of 14.4 per cent compared to December 2023 and 9.9 per cent below the previous 5-year average for the month.
Although the number of homes sold in 2024 was still well below long-term averages, the final three months of the year showed a significant increase in sales. This increase coincided with lower interest rates, which heightened buyer interest and activity in the market.
For 2024, total residential sales included 4,100 detached (up 5.5 per cent), and 1,368 townhouses (up 2.6 per cent). Sales also included 821 condominium units (down 8.8 per cent) and 477 semi-detached homes (up 5.5 per cent).
In December, the average sale price for all residential properties in Waterloo Region was $763,840. This represents a 3.3 per cent increase compared to December 2023 and a 1.4 per cent increase compared to November 2024.
- The average price of a detached home was $898,204. This represents a 6.0 per cent increase from December 2023 and an increase of 4.0 per cent compared to November 2024.
- The average sale price for a townhouse was $630,676. This represents a 1.7 per cent increase from December 2023 and an increase of 2.7 per cent compared to November 2024.
- The average sale price for an apartment-style condominium was $475,006. This represents a 3.7 per cent decrease from December 2023 and an increase of 5.5 per cent compared to November 2024.
- The average sale price for a semi was $644,786. This represents an increase of 5.1 per cent compared to December 2023 and an increase of 0.2 per cent compared to November 2024.
Average Sale Price – Monthly

Year-to-date, the average sale price for all residential properties in Waterloo Region decreased 0.3 per cent to $784,343 compared to 2023.
- The year-to-date average price of a detached home was $910,901. This represents a 0.8 per cent decrease compared to 2023.
- The year-to-date average sale price for a townhouse was $638,385. This represents a 2.3 per cent decrease compared to 2023.
- The year-to-date average sale price for an apartment-style condominium was $472,801. This represents a 2.0 per cent decrease compared to 2023.
- The year-to-date average sale price for a semi was $662,859. This represents a decrease of 2.1 per cent compared to 2023.
Average Sale Price – Year-to-date

| Monthly MLS® Home Price Index Benchmark Price | ||||||
| Kitchener-Waterloo | Cambridge | |||||
| Benchmark Type: | December 2024 | Monthly % Change | Yr./Yr. % Change | December 2024 | Monthly % Change | Yr./Yr. % Change |
| Composite | $717,200 | -0.4 | 0.6 | $725,000 | -1.7 | 2.4 |
| Single Family | $822,100 | -0.8 | 1.9 | $758,700 | -2.1 | 4.1 |
| Townhouse | $599,000 | 1.1 | -1.7 | $630,300 | 0.6 | -3.7 |
| Apartment | $445,600 | 0.3 | -5.5 | $478,600 | -0.2 | -4.0 |
| Annual MLS® Home Price Index Benchmark Price | ||||
| Kitchener-Waterloo | Cambridge | |||
| Benchmark Type: | 2024 | Yr./Yr. % Change | 2024 | Yr./Yr. % Change |
| Composite | $734,500 | -2.6 | $747,000 | -1.0 |
| Single Family | $846,500 | -1.3 | $781,900 | -0.5 |
| Townhouse | $612,900 | -2.9 | $646,600 | -0.9 |
| Apartment | $451,200 | -5.1 | $491,000 | 0.8 |

With the introduction of 30-year amortization options for all first-time homebuyers and new construction purchases now in effect as of December 15, 2024, along with an increased cap for insured mortgages now set at $1.5 million, we are optimistic that the housing market will become more accessible for aspiring homeowners in 2025
There were 346 new listings added last month, an increase 19.7 per cent compared to December of last year and a 1.6 per cent increase compared to the previous ten-year average for December.
In 2024, 13,176 new listings were added, an increase of 14.9 per cent compared to 2023, and a 10.8 per cent increase compared to the previous ten-year annual average.
The total number of homes available for sale in active status at the end of December was 1,092, an increase of 39.5 per cent compared to December of last year and 66.6 per cent above the previous ten-year average of 656 listings for December.
The number of months of inventory across the residential market is up 35.7 per cent compared to December of last year, now at 1.9 months. December’s rolling 12-month average was 2.6 months, which has risen from the 1.67 average of the past decade. In December, condominium apartments had the highest inventory, with 4.5 months’ supply, followed by townhouses with 2.7 months’ supply and detached homes with 1.3 months’ supply. The number of months of inventory represents the time it would take to sell off current inventories at the current sales rate
The average number of days to sell in December was 36, compared to 31 days in December 2023. The previous 5-year average is 23 days.
The average days to sell in 2024 was 23 days, compared to 19 days in 2023 and a previous 5-year average of 17 days.
If you have any questions at all, are thinking of making a move this winter, or are wondering what your home might be worth, give me a call or text to 519-497-4646 or shoot me an email to kevinbakerrealestate@gmail.com and we can sit down for a coffee and chat about your family’s needs going forward.
Have a great rest of your week!
Kevin
Average Sales Price – Municipality

Average Sales Price – Township

Monthly Sales By Property Type

Monthly Supply of Homes for Sale

Monthly Supply of Homes for Sale – By Property Type

Monthly Median Sales Price – By Property Type

Monthly Average Sales Price – By Property Type

Monthly Average Days on Market

November home sales up over last year in Waterloo Region
I hope you are having a great week! It looks like winter is here a little early this year but I am sure all the skiers are enjoying things already. With the snow, that reminds us that there is less than a month till Christmas, so hopefully you have a good chunk of your shopping already done.
The Waterloo region real estate stats are out for November and sales were up over last year, which is great news! Let’s take a look….
In November, a total of 539 homes were sold in the Waterloo Region. This represents a 21.1 per cent increase compared to the same period last year and a decline of 13.1 per cent compared to the average number of homes sold in the previous ten years for the same month.
Home sales have experienced a substantial increase in November compared to last year. However, sales were down from the previous month and remain below the historical averages for the area. November has shown more balanced conditions, and the increase in available homes has benefited buyers, giving them more options. We are also seeing an abundance of condo apartments still for sale in the region as well which is keeping things sluggish in that sector of the market.
Total residential sales in November included 331 detached homes (up 23.5 per cent from November 2023), and 113 townhouses (up 37.8 per cent). Sales also included 51 condominium units (down 17.7 per cent) and 44 semi-detached homes (up 37.5 per cent).
In November, the average sale price for all residential properties in Waterloo Region was $754,604. This represents a 0.2 per cent decrease compared to November 2023 and a 3.3 per cent decrease compared to October 2024.
- The average price of a detached home was $862,690. This represents a 3.1per cent decrease from November 2023 and a decrease of 2.6 per cent compared to October 2024.
- The average sale price for a townhouse was $615,222. This represents a 0.9 per cent increase from November 2023 and a decrease of 4.9 per cent compared to October 2024.
- The average sale price for an apartment-style condominium was $452,732. This represents a 0.5 per cent increase from November 2023 and a decrease of 6.2 per cent compared to October 2024.
- The average sale price for a semi was $643,672. This represents an increase of 4.5 per cent compared to November 2023 and a decrease of 1.0 per cent compared to October 2024.
Average Sale Price – Monthly

| MLS® Home Price Index Benchmark Price | ||||||
| Kitchener-Waterloo | Cambridge | |||||
| Benchmark Type: | November 2024 | Monthly % Change | Yr./Yr. % Change | November 2024 | Monthly % Change | Yr./Yr. % Change |
| Composite | $719,600 | 0.8 | 0.6 | $737,400 | -0.1 | 1.6 |
| Single Family | $828,900 | 0.9 | 2.1 | $775,000 | -0.1 | 3.3 |
| Townhouse | $592,300 | -0.4 | -4.9 | $626,700 | -0.3 | -5.3 |
| Apartment | $444,300 | 1.1 | -2.4 | $479,600 | -0.2 | -3.3 |

Current market conditions, marked by increased inventory and stable prices, suggest that now might be a good time to buy. This is especially true for those who can take advantage of lower interest rates and recent mortgage reforms. These reforms expand eligibility for 30-year mortgage amortizations to all first-time homebuyers and buyers of new construction. Additionally, a higher limit on insured mortgages will take effect on December 15, 2024.
There were 889 new listings added last month, an increase of 2.4 per cent compared to November last year and an 18.4 per cent increase compared to the previous ten-year average for November.
The total number of homes available for sale in active status at the end of November was 1,565 an increase of 20.0 per cent compared to November of last year and 57.8 per cent above the previous ten-year average of 992 listings for November.
The total inventory across the market increased by 16.7 percent, resulting in a 2.8 month supply of all property types by the end of November. Condominium apartments had the highest inventory, with 5.9 months’ supply, followed by townhouses with 3.9 months’ supply and detached homes with 2.0 months’ supply. The number of months of inventory represents the time it would take to sell off current inventories at the current sales rate.
The average time to sell a home in November was 27 days, consistent with the previous month. In November 2023, it took 24 days for a home to sell, and the five-year average was 19 days.
If you have any questions at all, are thinking of making a move this winter, or are wondering what your home might be worth, give me a call or text to 519-497-4646 or shoot me an email to kevinbakerrealestate@gmail.com and we can sit down for a coffee and chat about your family’s needs going forward.
Have a great rest of your week!
Kevin
Average Sales Price – Municipality

Average Sales Price – Township

Monthly Sales By Property Type

Monthly Supply of Homes for Sale

Monthly Supply of Homes for Sale – By Property Type

Monthly Median Sales Price – By Property Type

Monthly Average Sales Price – By Property Type

Monthly Average Days on Market

Homes Sales Up in October in Waterloo Region
I hope you had a great Halloween weekend with the kids!! The weather was pretty good this year and I heard from many friends that they had well in excess of 100 kids with the top one being 400!! That’s crazy.
Well November is here and the stats are out for the October Waterloo Region Real Estate market. Sales were up and prices were up slightly which is a great sign that the market is starting to turn around. With the recent rate drops that is starting to get buyers off the sidelines. Let’s take a look at the stats.
In October, a total of 604 homes were sold in the Waterloo Region. This represents a 7.1 per cent increase compared to the same period last year and a decline of 14.2 per cent compared to the average number of homes sold in the previous ten years for the same month.
For the first time since May, we witnessed an encouraging rise in home sales throughout Waterloo Region last month. This positive trend reflects a shift toward more balanced conditions within our housing market and a renewed confidence among buyers.
Total residential sales in October included 383 detached homes (up 15.4 per cent from October 2023), and 104 townhouses (down 20.0 per cent). Sales also included 66 condominium units (up 1.5 per cent) and 49 semi-detached homes (up 53.1 per cent).
In October, the average sale price for all residential properties in Waterloo Region was $779,008. This represents a 1.4 per cent increase compared to October 2023 and a 1.4 per cent decrease compared to September 2024.
- The average price of a detached home was $885,587. This represents a 0.6 per cent decrease from October 2023 and a decrease of 2.9 per cent compared to September 2024.
- The average sale price for a townhouse was $643,382. This represents a 0.2 per cent decrease from October 2023 and an increase of 7.8 per cent compared to September 2024.
- The average sale price for an apartment-style condominium was $484,429. This represents a 1.8 per cent increase from October 2023 and a decrease of 0.2 per cent compared to September 2024.
- The average sale price for a semi was $650,098. This represents a decrease of 1.2 per cent compared to October 2023 and a decrease of 0.7 per cent compared to September 2024.
Average Sale Price – Monthly

| MLS® Home Price Index Benchmark Price | ||||||
| Kitchener-Waterloo | Cambridge | |||||
| Benchmark Type: | October 2024 | Monthly % Change | Yr./Yr. % Change | October 2024 | Monthly % Change | Yr./Yr. % Change |
| Composite | $713,800 | -2.1 | -2.5 | $738,400 | -0.5 | -1.8 |
| Single Family | $821,900 | -2.7 | -1.1 | $775,900 | -0.2 | -0.6 |
| Townhouse | $594,500 | -1.4 | -5.8 | $628,500 | -2.0 | -5.9 |
| Apartment | $439,500 | 0.9 | -5.7 | $480,400 | -0.2 | -4.3 |

On Wednesday, October 23, the Bank of Canada cut its policy rate by 50 basis points to 3.75 per cent. This marks the fourth consecutive rate cut since June and is the most substantial decrease since March 2020. The interest rate cuts are certainly beneficial for those with variable mortgages and encouraging news for homeowners facing mortgage renewals.
There were 1,144 new listings added in Waterloo Region last month, an increase of 0.3 per cent compared to October last year and a 19.9 per cent increase compared to the previous ten-year average for October.
The total number of homes available for sale in active status at the end of October was 1,711 an increase of 21.0 per cent compared to October of last year and 48.5 per cent above the previous ten-year average of 1,153 listings for October.
The total inventory across the market increased by 19.2 percent, resulting in a 3.1-month supply of all property types by the end of October. Condominium apartments had the highest inventory, with 5.5 months’ supply, followed by townhouses with 3.8 months’ supply and detached homes with 2.5 months’ supply. The number of months of inventory represents the time it would take to sell off current inventories at the current sales rate.
The average time to sell a home in October was 27 days, one day shorter than the previous month. In October 2023, it took 21 days for a home to sell, and the five-year average is 18 days.
If you have any questions at all, are thinking of making a move this winter, or are wondering what your home might be worth, give me a call or text to 519-497-4646 or shoot me an email to kevinbakerrealestate@gmail.com and we can sit down for a coffee and chat about your family’s needs going forward.
Have a great week!
Kevin
Average Sales Price – Municipality

Average Sales Price – Township

Monthly Sales By Property Type

Monthly Supply of Homes for Sale

Monthly Supply of Homes for Sale – By Property Type

Monthly Median Sales Price – By Property Type
Monthly Average Sales Price – By Property Type

Monthly Average Days on Market

