
Real Estate Sales Down in October here in Waterloo Region
I hope you are having a wonderful weekend. Looks like we have snow in the region today but hopefully it doesn’t stay too long. I am sure we will be hearing Christmas music on the radio soon enough.
The Real estate market stats are out for October and things seem to have taken a bump up in the first 2 weeks of October but that was short lived with the market slowing down again near the end of the month. Let’s take a look at the breakdowns.
There were 569 homes sold last month. This represents a 6.7 per cent decrease compared to the same period last year and a decline of 18.4 per cent compared to the average number of homes sold in the previous ten years for the same month.
While October home sales in Waterloo Region lag behind historical averages, activity did pick up compared to September. With more listings available than we typically see this time of year and borrowing costs beginning to ease, buyers have the opportunity to explore a wider range of options.
Total residential sales in October included 371 detached homes (down 3.4 per cent from October 2024), and 89 townhouses (down 16.8 per cent). Sales also included 56 condominium units (down 16.4 per cent) and 49 semi-detached homes (down 2.0 per cent).
In October, the average sale price for all residential properties in Waterloo Region was $734,928. This represents a 5.6 per cent decrease compared to October 2024 and a 2.4 per cent decrease compared to September 2025.
- The average sale price of a detached home was $842,907. This represents a 4.8 per cent decrease from October 2024 and a decrease of 1.6 per cent compared to September 2025.
- The average sale price for a townhouse was $593,652. This represents an 8.2 per cent decrease from October 2024 and a decrease of 2.2 per cent compared to September 2025.
- The average sale price for an apartment-style condominium was $433,746. This represents a 10.2 per cent decrease from October 2024 and a decrease of 1.9 per cent compared to September 2025.
- The average sale price for a semi was $573,332. This represents a decrease of 11.9 per cent compared to October 2024 and a decrease of 7.7 per cent compared to September 2025.

| MLS® Home Price Index Benchmark Price (HPI) | ||||||
| Kitchener-Waterloo | Cambridge | |||||
| Benchmark Type: | October 2025 | Monthly % Change | Yr./Yr. % Change | October 2025 | Monthly % Change | Yr./Yr. % Change |
| Composite | $664,300 | -1.3 | -6.9 | $690,000 | -1.6 | -6.5 |
| Single Family | $784,000 | -1.3 | -4.6 | $730,400 | -1.7 | -5.9 |
| Townhouse | $548,700 | 0.1 | -7.7 | $598,300 | -2.1 | -4.8 |
| Apartment | $394,200 | -3.0 | -10.3 | $448,900 | -0.9 | -6.5 |

The Bank of Canada’s recent 0.25% rate cut and its hint that rates may hold steady could give home buyers the confidence to get preapproved for a mortgage. With a good number of homes for sale in Waterloo Region, now is a good time to start looking for your next home in case we see a surge in activity into the new year.
There were 1,236 new listings added last month, an increase 7.2 per cent compared to October last year and a 28.7 per cent increase compared to the previous ten-year average for October.
The total number of homes available for sale in active status at the end of October was 2,056, an increase of 23.6 per cent compared to October of last year and 90.2 per cent above the previous ten-year average of 1,081 listings for October.
The total inventory across the market increased by 30.0 percent, resulting in a 3.9-month supply of all property types by the end of October. Condominium apartments had the highest inventory, with 7.6 months’ supply, followed by townhouses with 4.7 months’ supply and detached homes with 3.1 months’ supply. The number of months of inventory represents the time it would take to sell all current inventories at the current sales rate.
The average time to sell a home in October was 31 days, one day less than the previous month. In October 2024, it took 27 days for a home to sell, and the five-year average was 19 days.
Average Sales Price – Municipality

Average Sales Price – Township
Monthly Sales By Property Type

Monthly Supply of Homes for Sale

Monthly Supply of Homes for Sale – By Property Type

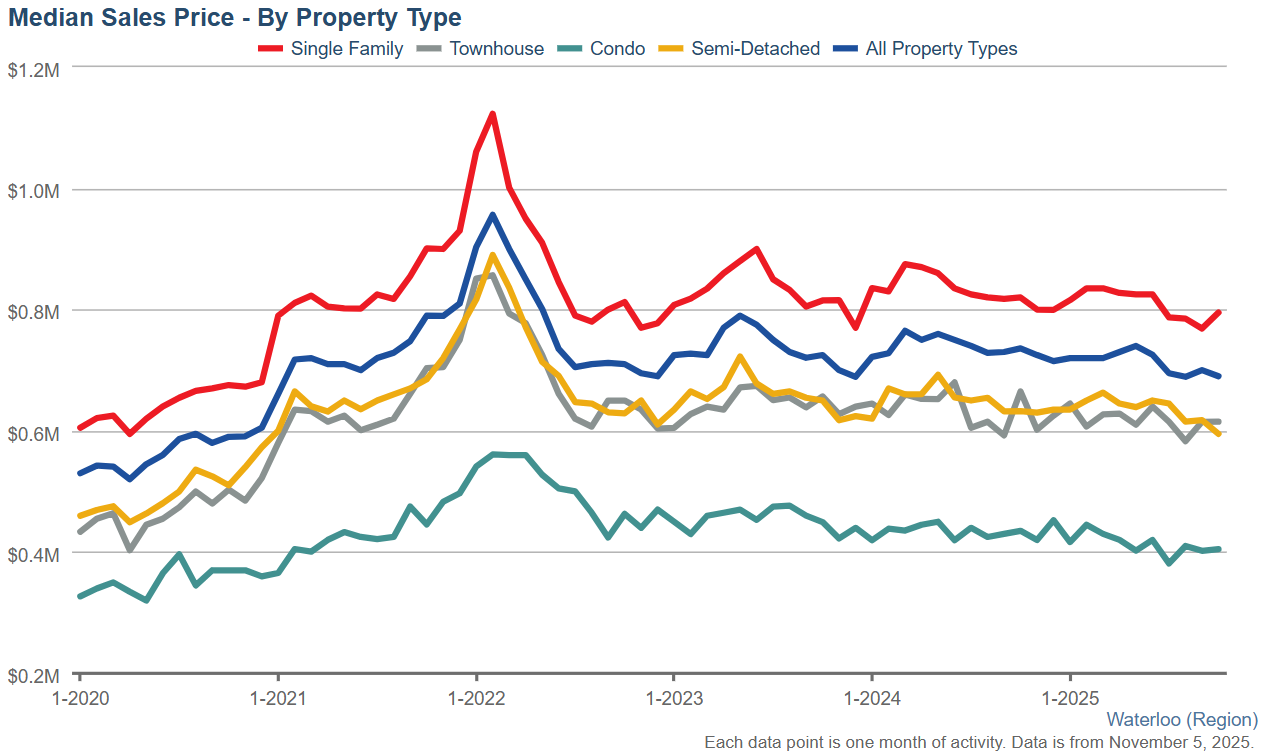
Monthly Median Sales Price – By Property Type
Monthly Average Sales Price – By Property Type

Monthly Average Days on Market

If you have any questions at all, are thinking of making a move this winter or are wondering what your home might be worth, give me a call or text to 519-497-4646 or shoot me an email to kevinbakerrealestate@gmail.com and we can sit down for a coffee and chat about your family’s needs going forward.
Have a great week!
Kevin

Leave a comment